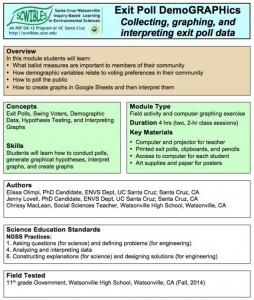
Exit Poll DemoGRAPHics

Exit_poll_demoGRAPHicsCollecting, Graphing, and Interpreting Exit Poll Data

by Elissa Olimpi, Jenny Lovell and Chrissy MacLean

Exit polls are used to determine or predict what people believe, how they feel about something, or in what way they will act. This module is designed to lead students through the process of designing an exit poll to answer a hypothesis about a local, state, or national election. The data they collect can be compiled and analyzed as if the poll were being presented on the news. In this way, students can gain a deeper understanding of one part of the legislative process.

Students learn: 1) What ballot measures are important to members of their community 2) How to poll the public, 3) How to generate graphical hypotheses and 4) How to create graphs in Google Sheets and interpret them.

Docs: fulltext.docx   form.docx   organizer.docx
Keywords: community, data, explanations, graphs, hypothesis, polling, questions

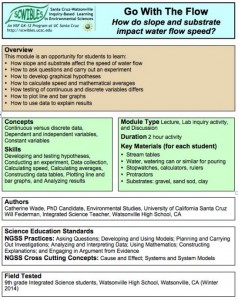
Go With the Flow

go with the flowThe Impact of Slope and Substrate on Water Flow Speed
by Catherine Wade and Will Federman

Water constantly cycles through the earth and the atmosphere. The study of water flow in streams and rivers and on impervious surfaces involves many variables. These include the slope or gradient of a stream, surface, or pipe and the type of substrate that water is flowing through. In this lab activity, students investigate how the speed of water flow changes with different slopes and different substrates.

Students learn: 1) How slope and substrate affect the speed of water flow, 2) How to ask questions, carry out an experiment and develop graphical hypotheses and 3) How to calculate speed and mathematical averages, and 4) How to plot line and bar graphs, and use data to explain results.

Docs: fulltext.docx   presentation.ppt   worksheet.docx
Keywords: argument, cause, data, erosion, HS-ESS2.C, explanations, graphs, hypothesis, investigations, math, models, questions, systems, water

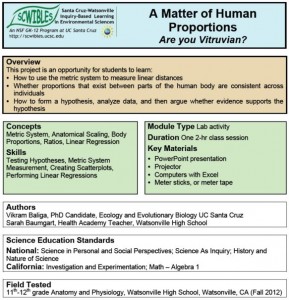
A Matter of Human Proportions

a matter of human proportionsAre You Vitruvian?

by Vikram Baliga and Sarah Baumgart

This module is an opportunity for students to learn: 1) How to use the metric system to measure linear distances; 2) Whether proportions that exist between parts of the human body are consistent across individuals; and 3) How to form a hypothesis, analyze data, and argue whether evidence supports the hypothesis.
Docs: fulltext.docx   metric.pdf   worksheet.docx   instructions.docx   handout.pdf   stats.pdf
Keywords: argument, communication, data, evidence, explanations, human anatomy, hypothesis, investigations, HS-LS1.A, HS-LS1.B, HS-LS3.B, math, models, patterns, proportions, questions, structure, systems, vitruvian man