Go Fish

Go_FishExploring Fisheries Management

by Rachel Zuercher, Ben Higgins, and Satina Ciandro

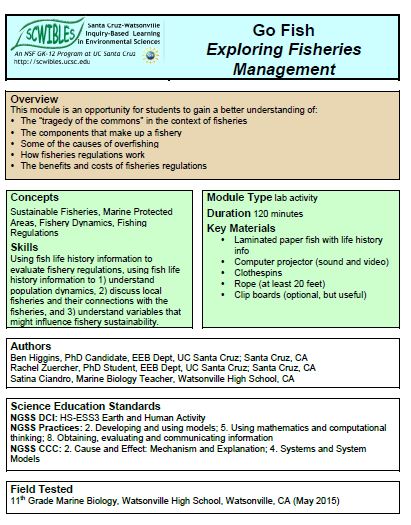
More than 1/3 of people in the world rely on fish as their major source of protein, however, global fisheries today face enormous challenges such as; overfishing, habitat loss, marine pollution and climate change. Fortunately, well-designed fisheries regulations can help mitigate these problems and ensure sustainability of fisheries into the future. Teaching students about fisheries can lead to a public that is informed regarding fisheries management, and a generation of conscious seafood consumers.

This module is an opportunity for students to learn: 1) The “tragedy of the commons” in the context of fisheries, 2) The components that make up a fishery, 3) Some of the causes of overfishing, 4) How fisheries regulations work, and 5) The benefits and costs of fisheries regulations.

Docs: GoFish_module_text.docx  West_coast_groundfish_template.pdf  intro.pdf   wrksht.docx   labwrksht.docx
Standards: HS-ESS3, Models, Cause and Effects, Systems
Keywords: cause communication economics fisheries HS-ESS3 math models natural resources systems tragedy of the commons

Argument from Evidence

argument from evidenceAssessing Argumentation Using the Topic of Fracking

by Jeff Jenkins, Chrissy MacLean and Dawn Krenz

Students living in rural communities impacted by ongoing and proposed extractive mineral development (fossil fuels and mining) will gain a greater appreciation and understanding for how different segments of society (government, corporate, and community) produce information to serve their own interests and how ‘factual’ information is often contested between these groups.

Students learn: 1) How to summarize the key points of an argument, 2) How to question the validity and subjectivity of information, and 3) How to summarize and convey a broad set of information in a succinct fashion.

Docs: fulltext.pdf   worksheet.docx
Keywords: communication, energy, facts, fossil fuels, fracking, governance, HS-LS2, models, patterns, structure, subjective

Predict This!

predict this!

Using Models to Observe Correlation and Improve Predictions

by Caleb Bryce, Kim Goetz and Pablo Barrick

In this mini-activity, students measure the masses of specific numbers of beans and graph their data. From their graph they determine a linear model equation. Using their model, they predict the number of beans based on a given mass. The students are asked to create their own model for estimating the number of marbles in a large jar.

Students learn: 1) How to make graphs to depict data and to assess patterns; 2) How correlation can be used to construct a practical model; 3) How to use a model to predict what can not be easily measured; and 4) How to use evidence to support an argument.

Docs: fulltext.pdf
Keywords: argument, evidence, models, patterns, prediction, proportion, scale, systems

Are You My Sister

Sister moduleBuilding Trees to Understand Evolutionary Relationships

by Ben Higgins and Satina Ciandro

How do students begin to make sense of the vast diversity of life?  Even when exposed to just a sliver of such diversity, it is commonplace for students to become disengaged.  This module is a first step in understanding why and how animals are classified and to become excited about the process.

The purpose of this module is to use the traits that each species possess to develop an understanding of species relatedness.  Upon completion of this module, students should have a better understanding of why assemblages of animals are classified together. This module is an opportunity for students to learn: 1) How organisms are grouped together and 2) How to interpret relationships among groups of organisms.

Docs: sequences.docx   cards.pdf
Keywords: argument, cause, data, evolutionary trees, explanations, HS-LS3.B, HS-LS3.A, HS-LS3.B, HS-LS4.A, investigations, models, MS-LS4.A, patterns, phylogenetics, traits

Round & Round It Goes

round and round it goesGetting Dizzy in Geosynchronous Orbit

by Caleb Bryce and Stephen Buchter

Some satellites “hover” over one place on the earth’s surface – a geosynchronous orbit. This module introduces students to the physics behind geosynchronous orbits. Students work together to find the relationship between the radius and the velocity of an object in circular motion. They graph their data and calculate the gravitational force needed to keep a satellite in geosynchronous orbit.

Students learn: 1) How circular motion is critical for satellites to stay in orbit, 2) How velocity and mass of an object in circular motion are related, and 4) How to use a graphical hypothesis to make predictions, interpret data, and create an argument from evidence.

A SCWIBLES video used as an intro to the Geosynchronous Orbit module created by Caleb Bryce and Stephen Buchter.

Docs: fulltext.docx   lecture.pptx   prequiz.pptx   quiz.pptx   quizkey.pptx   vandrlect.pptx
Keywords: argument, cause, data, geosynchronous, investigations, math, models, patterns, HS-PS2.A, HS-PS2.B, radius, systems, velocity


Go With the Flow

go with the flowThe Impact of Slope and Substrate on Water Flow Speed

by Catherine Wade and Will Federman

Water constantly cycles through the earth and the atmosphere. The study of water flow in streams and rivers and on impervious surfaces involves many variables. These include the slope or gradient of a stream, surface, or pipe and the type of substrate that water is flowing through. In this lab activity, students investigate how the speed of water flow changes with different slopes and different substrates.

Students learn: 1) How slope and substrate affect the speed of water flow, 2) How to ask questions, carry out an experiment and develop graphical hypotheses and 3) How to calculate speed and mathematical averages, and 4) How to plot line and bar graphs, and use data to explain results.

Docs: fulltext.docx   presentation.ppt   worksheet.docx
Keywords: argument, cause, data, erosion, HS-ESS2.C, explanations, graphs, hypothesis, investigations, math, models, questions, systems, water

Spinning Tops

spinning tops

Experiencing the Scientific Process

by Kristin deNesnera and Max Tarjan

Independently planning and conducting investigations can be a daunting process for students. This module prepares students to carry out a study from beginning to end and to experience the feeling of ownership that makse the process more exciting. For students who are considering doing a science fair project, this mini-module will give them a better sense of their responsibilities as a science fair participant.

Students learn: 1) How to carry out an investigative study from start to finish, 2) How to perform skills needed for the scientific process and 3) What skills are needed to perform an independent science project (like a school science fair project).

Docs: fulltext.docx   StudentWorksheet.docx   TeacherTips.docx  Worksheet_Espanol.docx
Keywords: argument, cause, data, explanations, investigations, models, patterns, HS-PS2.A, questions, science fair, scientific process, structure

Native Plant Garden

native plant gardenAssessing Biodiversity Using a School Garden

by Jenn Yost, Carla Fresquez and Bill Callahan

One way that we can protect biodiversity is by restoring degraded habitats to more natural conditions. This process can be simulated at a school through the restoration of a degraded plot of land into local native plant communities. Planting a native garden is a way to expose students to local biodiversity, teach them the importance of biodiversity, and mimic what can be done on a large scale to restore ecosystems once they are degraded.

Students 1) develop their own methods to quantify biodiversity, 2) measure biodiversity in a native garden, and 3) gain first hand experience in native plant gardens, restoration, and human impacts on environments.

Docs: fulltext.docx   lecture1.pdf   lecture2.pptx   handout.docx   datasetExs.xlsx   graphs.docx
Keywords: argument, biodiversity, cause, data, HS-ESS3.A, HS-ESS3.C, explanations, garden, investigations, HS-LS1.A, HS-LS2.A, HS-LS2.C, HS-LS4.A, HS-LS4.D, models, native plants, patterns, questions, restoration, systems

A Fact of Matter

a fact of matter
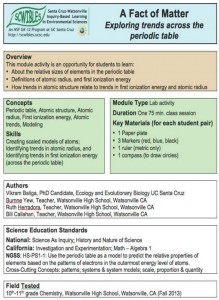
Exploring Trends Across the Periodic Table

by Vikram Baliga, Burnne Yew, Ruth Herradora and Bill Callahan

The periodic table is designed to reflect the key properties of all of the elements. This module gives an overview of the trends we see within each group of the periodic table. This module addresses NGSS Performance Expectation HS-PS1-1 by having students analyze trends in the periodic table in relation to atomic radius and first ionization energy.

Students learn: The relative sizes of elements in the periodic table; The definitions of atomic radius and first ionization energy; and How trends in atomic structure relate to trends in first ionization energy and atomic radius.

Docs: fulltext.pdf   lecture.pdf   handout.pdf
Keywords: atomic radius, atomic stucture, math, models, patterns, periodic table, HS-PS1.A, questions, scale, systems

Land to Sea

land to seaSearching for the Source of Pollutants

by Max Tarjan and Will Federman

In this module students work in small groups with map-based data to learn about watersheds and to find a likely source of pollutants. After a short introduction, students work together to intrepret ther maps provided and to support an argument, stating where the pollutant is coming from, using the map data as evidence. The module provides all the supporting materials needed to run a 90 minute activity.

In this module, students learn: 1) How substances and organisms on land can affect ocean life, 2) How human activities may disrupt ecosystem integrity, to identify the watershed that supplies a river, 3) How to interpret maps of watersheds and land use, and 4) How to combine information from different maps using map scales, and 5) How to make estimates based on map data, and engage in argument from evidence.

Docs: fulltext.pdf   introlect.pdf   summarylect.pdf   handout.pdf   watersheds.pdf   landuse.pdf   seaotters.pdf   sealions.pdf
Keywords: argument, cause, communication, data, HS-ESS2.C, evidence, explanations, HS-LS2.A, HS-LS2.C, mapping, marine mammals, models, patterns, pollution, scale, systems, watersheds

Top Carnivore

top carnivoreTrophic Cascades and Predator-Prey Dynamics

by Veronica Yovovich and Dan Johnston

This module presents a “game” activity in which students learn about trophic cascades and how the different elements of a food chain interact. The module explores the importance of top-down regulation and how predators may regulate the habitats in which they live.

In this module, students learn: 1) How predators and prey interact, 2) How human activities may disrupt ecosystem integrity, 3) How to formulate predictions and hypotheses, 4) How to engage in argument from evidence, make and interpret simple graphs, and make estimates based on data they collect.

Docs: fulltext.pdf   handout.pdf   homework.pdf   cards.pdf
Keywords: argument, cause, data, evidence, food web, graphs, HS-LS2.A, HS-LS2.C, math, models, predators, prey, stability, systems, trophic cascades

Oil Pollution Solutions

oil pollution sollution

Oil Pollution in the Marine Environment

by Kristin deNesnera and Satina Ciandro

In this “hands-on” module, students learn about: sources of oil pollution in the marine environment; the effects of oil pollution on marine life, human health, and economies; examples of major oil spills; and the challenges involved in responding to and cleaning up an oil spill.

Students learn: 1) How human activities cause oil pollution, 2) How oil pollution affects marine resources, the environment, 3) About various oil spill clean-up technologies and sorbent materials absorptivity, and 4) About the challenges related to oil spill clean-up.

A video to accompany an inquiry based educational activity (module) used in the SCWIBLES program. Created by Kristin de Nesnera.

Docs: fulltext.pdf   lecture.pdf   activity.docx   costchart.docx
Keywords: clean up, data, engineering, HS-ESS3.A, HS-ESS3.C, HS-ETS1.C, HS-ETS2.B, explanations, investigations, marine, math, models, oil pollution, HS-PS1.A, questions, scale, stability, structure, systems

Environmental Science from Space

environmental science from space

Remote Sensing and the Electromagnetic Spectrum

by Kristin McCully and Jack Horner

Students learn what remote sensing is, how it works, and how scientists use it, with a focus on Landsat satellite and imagery. They create, and then interpret, a remote sensing image of a planet and remote sensing imagery available on the Internet. Students review the structure of a wave; solve problems using speed, wavelength, and frequency; and discuss the uses of each type of radiation in the electromagnetic spectrum. Finally, students examine and analyze a remote sensing image of a rain forest.

Docs: fulltext.pdf   presentation.pdf   handout.doc   handoutkey.doc
Keywords: data, electromagnetic spectrum, HS-ESS2.D, HS-ETS1.A, explanations, iimagery, models, HS-PS4.A, HS-PS4.B, HS-PS4.C, rain forest, remote sensing, scale, systems

A Matter of Human Proportions

a matter of human proportionsAre You Vitruvian?

by Vikram Baliga and Sarah Baumgart

This module is an opportunity for students to learn: 1) How to use the metric system to measure linear distances; 2) Whether proportions that exist between parts of the human body are consistent across individuals; and 3) How to form a hypothesis, analyze data, and argue whether evidence supports the hypothesis.
Docs: fulltext.docx   metric.pdf   worksheet.docx   instructions.docx   handout.pdf   stats.pdf
Keywords: argument, communication, data, evidence, explanations, human anatomy, hypothesis, investigations, HS-LS1.A, HS-LS1.B, HS-LS3.B, math, models, patterns, proportions, questions, structure, systems, vitruvian man

What’s Your Walk Score

what's your walk scoreWalkable Neighborhoods as Healthy, Social and Safe Communities

by Jeff Jenkins and Sarah Baumgart

Students in low income communities are increasingly faced with poor nutrition and limited exercise options. One way to combat this is to teach about walkable communities. Teaching about walkable communities will also get students to think about land use in their own neighborhood, will make them more aware of their surroundings, and will provide direction for improving their communities.

Students learn: 1) Why safe and healthy communities are related to walkability, 2) How walkability of neighborhoods/schools can be assessed through a walk score, 3) How to think about, interpret, and communicate spatial information, and 4) What factors in their community can be improved to increase walkability.

Students, particular those in low income communities, are increasingly faced with poor nutrition and exercise options. One way to combat this while also building community is to teach about walkable communities.

Docs: fulltext.docx   worksheet.docx
Keywords: communication, community, health, HS-LS2.A, HS-LS2.D, models, patterns, structure, sustainability, urban design, walk score, walkability

Ecosystem in a Jar

ecosystem in a jarExperimenting With Plant Growth
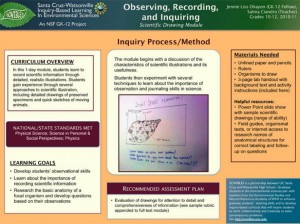
by Kristin McCully and Jack Horner

Students, as a class, develop, conduct, and analyze an experiment to determine what affects the growth of an “ecosystem in a jar.” “Ecosystems” include soil, water, plant seeds, and other items decided by the class in glass jars. Discussion should focus on experimental design and analysis, but instructor can incorporate ecosystem ecology, biodiversity, food chains and webs, photosynthesis and respiration, and other concepts of ecology and biology.

Docs: fulltext.pdf
Keywords: cause, communication, data, ecosystem, experimental design, investigations, jar, HS-LS2.A, HS-LS2.D, math, models, patterns, photosynthesis, plants, questions, respiration, stability, structure, systems

Spit Lab

spit labMacromolecules and Environmental Effects on Enzymes

by Jenn Yost and Erin Mejía

In this module students will do an activity and a lab. A cut-out activity illustrates the anabolic and catabolic functions of enzymes, enzyme specificity, and the individual components of macromolecules. Students then test the effects of temperature on enzymatic activity in spit.

Docs: fulltext.pdf   module.doc   worksheet.doc   enzymes.pdf   lab.doc   lablecture.pdf   enzymelecture.pdf
Keywords: cause, enzymes, investigations, HS-LS1.A, macromolecules, math, models, HS-PS1.B, spit, structure, systems

There’s Something in the Water

there's something in the waterInvestigating Water Quality in Local Watersheds

by Yiwei Wang and Dan Johnston

This module teaches students about why watersheds are important
components of the ecosystem and how their health can be impacted by human activities. The objectives are to get students to learn what man-made pollutants are entering their local watersheds, predict which water bodies are most impacted by these contaminants, and test their ideas by using kits to measure water quality. Students will learn how jeopardizing the integrity of the watershed impacts both human health and that of the ecosystem and consider potential ways to mitigate these effects.

Docs: fulltext.pdf   final.doc   handout.doc   handoutkey.doc
Keywords: data, ecosystem health, HS-ESS2.C, HS-ESS3.A, explanations, investigations, HS-LS2.C, models, pollution, water quality, watersheds

Learn From Seabird Barf

what can seabird barf tell us

Seabirds and Marine Debris

by Kristin McCully and Jack Horner

Albatross boluses provide a record of what the seabirds fed on, which often includes plastic marine debris. In this project, each class builds a research question, hypothesis, procedures, and datasheet before dissecting albatross boluses from the Northwestern Hawaiian Islands and analyzing their results statistically and graphically. This project is framed by discussion of how marine debris impacts marine organisms and how humans can reduce their use and waste of plastics.

Docs: Fulltext.pdf   Worksheet.pdf   Presentation.pdf
Keywords: albatross, data, HS-ESS3.C, explanations, investigations, HS-LS1.B, marine, marine debris, math, models, patterns, plastic, pollution, questions, seabirds, systems

The Highest Tide

the highest tideScientific, Comic, and Poetic Species Descriptions

by Tara Cornelisse

Using passages from The Highest Tide by Jim Lynch, students learn that there are different ways to describe an object or an organism, and that these may have different effects on readers, but all of them can include plenty of detailed information. Students first listen to several of Lynch’s most vivid and creative descriptions of marine organisms, and take turns in teams drawing those organisms as they visualize them, and attempting to categorize the descriptions as scientific, comic, or poetic–or as combinations–locating key words or phrases that convey humor, feeling, and extensive, factual information. Then they research and describe a marine specimen organism in detail three times, in response to three short prompts, which emphasize the three respective purposes: scientific, poetic, and comic.

Docs: Fulltext.pdf
Keywords: communication, description, ecology, highest tide, investigation, marine, models, structure

Observing, Recording, and Inquiring

observing recording and inquiryingScientific Drawing

by Jennie Liss Ohayon and Satina Ciandro

Students learn about the importance of recording scientific information through detailed, realistic illustrations. This 75-minute module offers students experience with several approaches to scientific illustration, including detailed drawings of preserved specimens and quick sketches of moving animals. They also learn about trait variation through drawings that compare different individuals of the same species. The module aims to teach the principles of recording scientific information and to make the practice of creating scientific artwork accessible to everyone, including those without an extensive background in either science or art.

Docs: Fulltext.pdf
Keywords: inquirying, HS-LS3.B, models, observing, recording, scale, scientific illustration