Size Matters

size matters
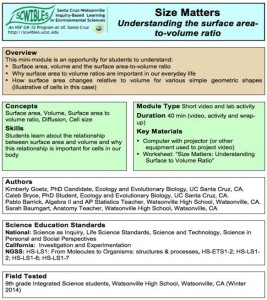
Understanding the Surface Area-to-Volume Ratio

by Caleb Bryce, Kimberly Goetz, Pablo Barrick and Sarah Baumgart

The surface area-to-volume relationship is important for the function of both living things (ex: lung anatomy, tree roots, cell size, brain vascularization) and many human-made objects (ex: car radiators, air conditioning units). By understanding that surface area increases at a slower rate than volume as objects get larger, students can appreciate: why small cell size is advantageous; why plants benefit from a branched network of stems, leaves and roots; and why a variety of everyday objects are shaped and sized the way they are.

In this module, students learn: 1) About the relationship between surface area and volume, 2) Why this relationship is important for cells in our body.

Fellows Kim Goetz and Caleb Bryce produced this video explaining the concept of surface area to volume. A diffusion experiment using colored agar cubes, and various real life examples are used to help students understand this concept.

Docs: fulltext.docx   presentation.pptx   worksheet.docx   worksheetkey.docx
Keywords: HS-ETS1.B, HS-LS1, HS-LS1.B, HS-LS1.F, HS-LS1.G, surface area, volume

Argument from Evidence

argument from evidenceAssessing Argumentation Using the Topic of Fracking

by Jeff Jenkins, Chrissy MacLean and Dawn Krenz

Students living in rural communities impacted by ongoing and proposed extractive mineral development (fossil fuels and mining) will gain a greater appreciation and understanding for how different segments of society (government, corporate, and community) produce information to serve their own interests and how ‘factual’ information is often contested between these groups.

Students learn: 1) How to summarize the key points of an argument, 2) How to question the validity and subjectivity of information, and 3) How to summarize and convey a broad set of information in a succinct fashion.

Docs: fulltext.pdf   worksheet.docx
Keywords: communication, energy, facts, fossil fuels, fracking, governance, HS-LS2, models, patterns, structure, subjective

Predict This!

predict this!

Using Models to Observe Correlation and Improve Predictions

by Caleb Bryce, Kim Goetz and Pablo Barrick

In this mini-activity, students measure the masses of specific numbers of beans and graph their data. From their graph they determine a linear model equation. Using their model, they predict the number of beans based on a given mass. The students are asked to create their own model for estimating the number of marbles in a large jar.

Students learn: 1) How to make graphs to depict data and to assess patterns; 2) How correlation can be used to construct a practical model; 3) How to use a model to predict what can not be easily measured; and 4) How to use evidence to support an argument.

Docs: fulltext.pdf
Keywords: argument, evidence, models, patterns, prediction, proportion, scale, systems

Are You My Sister

Sister moduleBuilding Trees to Understand Evolutionary Relationships

by Ben Higgins and Satina Ciandro

How do students begin to make sense of the vast diversity of life?  Even when exposed to just a sliver of such diversity, it is commonplace for students to become disengaged.  This module is a first step in understanding why and how animals are classified and to become excited about the process.

The purpose of this module is to use the traits that each species possess to develop an understanding of species relatedness.  Upon completion of this module, students should have a better understanding of why assemblages of animals are classified together. This module is an opportunity for students to learn: 1) How organisms are grouped together and 2) How to interpret relationships among groups of organisms.

Docs: sequences.docx   cards.pdf
Keywords: argument, cause, data, evolutionary trees, explanations, HS-LS3.B, HS-LS3.A, HS-LS3.B, HS-LS4.A, investigations, models, MS-LS4.A, patterns, phylogenetics, traits

E-Literacy

E-LiteracyEvaluating Online Sources

by Elissa Olimpi, and Chrissy MacLean

Students are faced with an overwhelming amount of information online and need to learn how to sift through available sources to find ones that are credible and appropriate for a specific research task. Many students have a basic understanding of the importance of evaluating sources, but have not practiced source evaluation. This lesson guides students through the process by highlighting questions that the student should ask of the source in order to decide if it is reliable.

Students learn: 1) A systematic approach for evaluating the credibility of internet sources 2) How to determine which sources to use for specific tasks, 3) How to cite textual evidence, and 4) How to corroborate or challenge claims.

Docs: fulltext.docx   intro.pptx   assessment.docx
Keywords: communication, evidence, sources


Says Who

says who.Deciphering a Scientific Article

by Hamutahl Cohen and Dan Johnston

The goal of this module is to teach students how to read and understand scientific articles. This skill can be applied to answering a variety of research questions from different disciplines of science and engineering. The context for this inquiry is the impact of climate change on a species. Although climate change is the specific prompt used here, the prompt can be modified for different classroom topics and different courses.

Students learn: 1) How to read a scientific article, 2) How to use scientific articles to answer questions, and 3) How to cite information in APA format.

Docs: fulltext.docx   intro.ppt   handout.docx   pikas.pdf   bears.pdf   turtles.pdf
Keywords: APA citation, cause, climate change, communication, HS-ESS3.C, HS-LS2.A, scientific articles


Round & Round It Goes

round and round it goesGetting Dizzy in Geosynchronous Orbit

by Caleb Bryce and Stephen Buchter

Some satellites “hover” over one place on the earth’s surface – a geosynchronous orbit. This module introduces students to the physics behind geosynchronous orbits. Students work together to find the relationship between the radius and the velocity of an object in circular motion. They graph their data and calculate the gravitational force needed to keep a satellite in geosynchronous orbit.

Students learn: 1) How circular motion is critical for satellites to stay in orbit, 2) How velocity and mass of an object in circular motion are related, and 4) How to use a graphical hypothesis to make predictions, interpret data, and create an argument from evidence.

A SCWIBLES video used as an intro to the Geosynchronous Orbit module created by Caleb Bryce and Stephen Buchter.

Docs: fulltext.docx   lecture.pptx   prequiz.pptx   quiz.pptx   quizkey.pptx   vandrlect.pptx
Keywords: argument, cause, data, geosynchronous, investigations, math, models, patterns, HS-PS2.A, HS-PS2.B, radius, systems, velocity


Toxic Avengers

Featured

toxic avengersTools for Uncovering the Human Geography of Pollution

by Jenny Lovell and Dawn Krenz

Environmental Justice (EJ) describes the trend of environmental impacts disproportionately affecting minority communities. It is a great subject to get students engaged about their neighborhoods and health. The Toxics Movement is closely related to EJ and shares the common interest of all people having the right to a clean and healthy environment.

Students learn: 1) How to look up public census data, 2) How to find toxic sites in their neighborhood, 3) How to formulate a testable question regarding census data and toxic sites, 4) How to synthesize data and draw conclusions that answer their questions, and 5) The key components of presenting a social science project to an audience.

Docs: fulltext.docx   presentation.pptx   activity.docx   checklist.docx
K
eywords: argument, cause, communication, data, environmental justice, mapping, questions, toxic sites


Go With the Flow

go with the flowThe Impact of Slope and Substrate on Water Flow Speed

by Catherine Wade and Will Federman

Water constantly cycles through the earth and the atmosphere. The study of water flow in streams and rivers and on impervious surfaces involves many variables. These include the slope or gradient of a stream, surface, or pipe and the type of substrate that water is flowing through. In this lab activity, students investigate how the speed of water flow changes with different slopes and different substrates.

Students learn: 1) How slope and substrate affect the speed of water flow, 2) How to ask questions, carry out an experiment and develop graphical hypotheses and 3) How to calculate speed and mathematical averages, and 4) How to plot line and bar graphs, and use data to explain results.

Docs: fulltext.docx   presentation.ppt   worksheet.docx
Keywords: argument, cause, data, erosion, HS-ESS2.C, explanations, graphs, hypothesis, investigations, math, models, questions, systems, water

Physics of Motion

Motion ModuleHow Far Can You Hit the Ball?

by Ben Higgins, Caleb Bryce and Stephen Buchter

Objects are in motion all around us, yet it is often difficult to measure even the basic properties of moving objects such as their velocity, acceleration, or turning angles. Fortunately, a freely available software, called Tracker, lets you measure the underlying mechanics for any object in motion. All you need is a computer and a video of the motion that you’d like to investigate. This module uses a baseball bat swing to show how the Tracker software works.

This module is an opportunity for students to: 1) Learn how to use the Tracker software, 2) Hypothesize what factors are responsible for how far a batter can hit a ball, 3) See how far they can hit the ball, and 4) Test a hypothesis and then interpret and communicat the results.

A SCWIBLES video that explains the use of "Tracker", a free software app. Tracker allows you to gather physics data on the motion of any moving object seen in a video.

Docs: fulltext.docx   wrksht.docx
Keywords: acceleration, arguing from evidence, cause, computational thinking, HS-PS2, investigations, mechanics, motion, newtonian physics, projectile, velocity

Spinning Tops

spinning tops

Experiencing the Scientific Process

by Kristin deNesnera and Max Tarjan

Independently planning and conducting investigations can be a daunting process for students. This module prepares students to carry out a study from beginning to end and to experience the feeling of ownership that makse the process more exciting. For students who are considering doing a science fair project, this mini-module will give them a better sense of their responsibilities as a science fair participant.

Students learn: 1) How to carry out an investigative study from start to finish, 2) How to perform skills needed for the scientific process and 3) What skills are needed to perform an independent science project (like a school science fair project).

Docs: fulltext.docx   StudentWorksheet.docx   TeacherTips.docx  Worksheet_Espanol.docx
Keywords: argument, cause, data, explanations, investigations, models, patterns, HS-PS2.A, questions, science fair, scientific process, structure

What’s that Sound?

what's that soundQuantifying and Describing Marine Mammal Sounds

by Caleb Bryce, Kimberly Goetz and Burnee Yew

Marine mammals use sound for feeding, communication, predator avoidance, and navigation. Students are introduced to the properties of sound by quantifying and describing sounds from several types of marine mammals (toothed whales, baleen whales, sea lions, and true seals). Students examine differences in sounds between marine mammal species and then use that knowledge to predict the source of a mystery sound.

Students learn: 1) Basic properties of sound, 2) How to interpret spectograms and waveforms, 3) Why marine mammals use sound, and 4) How to describe the diversity of sounds made by marine mammals.

Docs: fulltext.docx   labworksheet.docx   labworksheetkey.xls   worksheet.docx   worksheetkey.docx   photocredit.xlsx
Keywords: bioacoustics, communication, HS-LS2, HS-PS4, marine mammals, sound

A Fact of Matter

a fact of matterExploring Trends Across the Periodic Table

by Vikram Baliga, Burnne Yew, Ruth Herradora and Bill Callahan

The periodic table is designed to reflect the key properties of all of the elements. This module gives an overview of the trends we see within each group of the periodic table. This module addresses NGSS Performance Expectation HS-PS1-1 by having students analyze trends in the periodic table in relation to atomic radius and first ionization energy.

Students learn: The relative sizes of elements in the periodic table; The definitions of atomic radius and first ionization energy; and How trends in atomic structure relate to trends in first ionization energy and atomic radius.

Docs: fulltext.pdf   lecture.pdf   handout.pdf
Keywords: atomic radius, atomic stucture, math, models, patterns, periodic table, HS-PS1.A, questions, scale, systems

Splitting Atoms

splitting atomsArguments From Evidence to Address Nuclear Energy Policy

by Duran Fiack and Chrissy MacLean

In this module students represent the views of an interest group that either supports or opposes the expansion of nuclear-generated energy in the U.S. Students learn about the source of energy within the U.S. with a focus on the potential benefits and risks associated with expansion of nuclear energy.

In this module, students learn: How to formulate arguments from evidence, how to examine different views from a range of interest groups, how to evaluate a U.S. policy statement from an interest group perspective. Students will also learn how to understand the issues surrounding public policy decisions and the potential challenges of finding a political solution in a democratic society.

Docs: fulltext.pdf   intro.pdf   reading.pdf   groupnames.pdf   worksheet.pdf
Keywords: argument, cause, communication, HS-ESS3.A, HS-ESS3.C, HS-ESS3.D, evidence, nuclear energy, policy, scale

Where’s My Phone

Where's my phone

Using GPS to Learn About Location on the Earth’s Surface

by Tim Norris and Will Federman

Students learn how to use latitude and longitude to describe location on the Earth’s surface. Students also learn how Global Positioning Systems (GPS) function and how we can use everyday technology (for example, smart phones) to find latitude and longitude. Two concepts are introduced: 1) Properties of electromagnetic waves (the speed of light and the relationship between distance, velocity and time), and 2) Geometric concept of triangulation. Students map the point locations of an object of interest (for example trees, benches, etc.) and then view the results of their mapping as displayed in a web page and in Google Earth®. They also learn how to place their maps into a word processing (Microsoft Word®) document.

Docs: fulltext.docx   lecture.pdf   activity.docx   notes.docx   help.docx
Keywords: communication, distance, HS-ESS2.B, GPS, investigations, latitude, longitude, mapping, math, HS-PS4.C, scale, time, velocity

My Digital Watershed

my digital watershedAnalyzing Watersheds in Google Earth

by Tim Norris and Will Federman

Students perform a computer lab activity to answer basic geographic questions about the watersheds in which they live. This module is an opportunity for students to: 1. Learn how to read topographic maps, 2. Use computers and GIS to visualize topographic information, 3. Learn how to draw using a computer, 4. Learn how to measure area and distance using a computer, and 5. Learn how to interpret satellite imagery to answer basic questions about land-use.

Docs: fulltext.docx   intro.pdf   help.pdf   lecture.pdf   worksheet.docx
Keywords: area, argument, communication, data, distance, HS-ESS3.A, HS-ESS3.C, HS-ETS1.A, explanations, GIS, Google Earth, investigations, mapping, scale, systems, watershed

The California Water Puzzle

the california water puzzleFreshwater Distribution Around California

by Tim Norris and Will Federman

Students research California’s fresh water supply and demand with sets of printed maps. They then solve the “California Freshwater Puzzle” based on their new knowledge of the geographies of freshwater supply (sources) and demand (uses) in California. This module is an opportunity for students to: learn how to read different kinds of maps, combine more than one source of information to make an analysis or an argument, learn about freshwater supply and demand in California, and solve the real-world problem of freshwater supply and demand in California.

Docs: fulltext.doc   prompt.docx   worksheet.docx   maps.pdf
Keywords: argument, HS-ESS3, evidence, mapping, water

Environmental Science from Space

environmental science from space

Remote Sensing and the Electromagnetic Spectrum

by Kristin McCully and Jack Horner

Students learn what remote sensing is, how it works, and how scientists use it, with a focus on Landsat satellite and imagery. They create, and then interpret, a remote sensing image of a planet and remote sensing imagery available on the Internet. Students review the structure of a wave; solve problems using speed, wavelength, and frequency; and discuss the uses of each type of radiation in the electromagnetic spectrum. Finally, students examine and analyze a remote sensing image of a rain forest.

Docs: fulltext.pdf   presentation.pdf   handout.doc   handoutkey.doc
Keywords: data, electromagnetic spectrum, HS-ESS2.D, HS-ETS1.A, explanations, iimagery, models, HS-PS4.A, HS-PS4.B, HS-PS4.C, rain forest, remote sensing, scale, systems

A Matter of Human Proportions

a matter of human proportionsAre You Vitruvian?

by Vikram Baliga and Sarah Baumgart

This module is an opportunity for students to learn: 1) How to use the metric system to measure linear distances; 2) Whether proportions that exist between parts of the human body are consistent across individuals; and 3) How to form a hypothesis, analyze data, and argue whether evidence supports the hypothesis.
Docs: fulltext.docx   metric.pdf   worksheet.docx   instructions.docx   handout.pdf   stats.pdf
Keywords: argument, communication, data, evidence, explanations, human anatomy, hypothesis, investigations, HS-LS1.A, HS-LS1.B, HS-LS3.B, math, models, patterns, proportions, questions, structure, systems, vitruvian man

Contour What?

contour whatby Timothy Norris and Will Federman

This modules is designed as an introduction to understanding topographic maps and GIS using Google Earth. Students perform a computer lab activity to learn how to read topographic maps, measure geographical features, and use geographic information systems (GIS).

Docs: fulltext.docx   lab.pdf   lecture.pdf
Keywords: argument, communication, contour, data, HS-ESS3.A, HS-ESS3.C, HS-ETS1.B, HS-ETS1.C, explanations, GIS, Google Earth, investigations, mapping, patterns, scale, systems

There’s Something in the Water

there's something in the waterInvestigating Water Quality in Local Watersheds

by Yiwei Wang and Dan Johnston

This module teaches students about why watersheds are important
components of the ecosystem and how their health can be impacted by human activities. The objectives are to get students to learn what man-made pollutants are entering their local watersheds, predict which water bodies are most impacted by these contaminants, and test their ideas by using kits to measure water quality. Students will learn how jeopardizing the integrity of the watershed impacts both human health and that of the ecosystem and consider potential ways to mitigate these effects.

Docs: fulltext.pdf   final.doc   handout.doc   handoutkey.doc
Keywords: data, ecosystem health, HS-ESS2.C, HS-ESS3.A, explanations, investigations, HS-LS2.C, models, pollution, water quality, watersheds

Rocks Rock!

Rocks rockRock cycle and igneous rock formation

by Tara Cornelisse

In this 1-day module, students use Houghton-Mifflin’s interactive online textbook, Exploring Earth, to learn about the rock cycle, the different types of rocks and how rocks are formed. They then look specifically at igneous rocks and learn how crystals develop and vary with temperature of cooling. Based on observations of cooling crystals, students develop a hypothesis, in groups, and carry out experiments to test their hypotheses. Students then compare real samples of different igneous rocks, using their results to interpret how the rock samples were cooled, answering questions about intrusive and extrusive rock formation processes.

Docs: Fulltext.pdf   RockLab.pdf   IgneousLab.pdf   IgneousKey.pdf
Keywords: data, HS-ESS3.A, explanations, geology, igneous, investigations, patterns, HS-PS1.A, questions, rock cycle, rock formation, rocks, structure

Observing, Recording, and Inquiring

observing recording and inquiryingScientific Drawing

by Jennie Liss Ohayon and Satina Ciandro

Students learn about the importance of recording scientific information through detailed, realistic illustrations. This 75-minute module offers students experience with several approaches to scientific illustration, including detailed drawings of preserved specimens and quick sketches of moving animals. They also learn about trait variation through drawings that compare different individuals of the same species. The module aims to teach the principles of recording scientific information and to make the practice of creating scientific artwork accessible to everyone, including those without an extensive background in either science or art.

Docs: Fulltext.pdf
Keywords: inquirying, HS-LS3.B, models, observing, recording, scale, scientific illustration

Energy for Change

energy for changeGreen Energy Audit

by Jennie Liss Ohayon and Dan Johnston

Students and teachers can use parts or all of our step-by-step workbook to conduct an energy audit of their school. The whole module is designed to strengthen students’ understanding of concepts in physics such as power and energy by making real-world connections, and by using appropriate technology to inquire into their own environment (particularly the lighting systems of their school). They calculate potential energy savings from both behavioral (e.g., turning lights off) and operational (e.g., retrofits) measures. Finally, students synthesize their data and develop specific recommendations for administrators or the public.

Docs: Fulltext.pdf   Workbook.pdf
Keywords: data, energy, energy savings, explanations, green energy, investigations, math, power, HS-PS3.A, HS-PS4.C, questions

Filtering out Pollution

filtering out pollutionLowering Turbidity to Increase Water Quality

by Tara Cornelisse and Ruben Mejia

In this lab activity, students learn what turbidity is and how to measure it using a turbidity sensor connected to a data logger. Students then use an array of readily available materials to investigate how to build a water filter that efficiently reduces turbidity.

Docs: fulltext.pdf
Keywords: build, data, HS-ESS3.A, HS-ESS3.C, HS-ETS1.C, HS-ETS2.B, explanations, investigations, HS-PS1.A, questions, turbidity, water, water filter, water quality