Go Fish

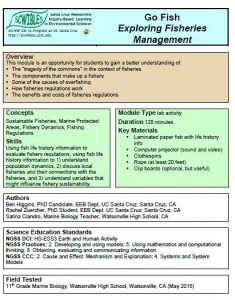
Go_FishExploring Fisheries Management

by Rachel Zuercher, Ben Higgins, and Satina Ciandro

More than 1/3 of people in the world rely on fish as their major source of protein, however, global fisheries today face enormous challenges such as; overfishing, habitat loss, marine pollution and climate change. Fortunately, well-designed fisheries regulations can help mitigate these problems and ensure sustainability of fisheries into the future. Teaching students about fisheries can lead to a public that is informed regarding fisheries management, and a generation of conscious seafood consumers.

This module is an opportunity for students to learn: 1) The “tragedy of the commons” in the context of fisheries, 2) The components that make up a fishery, 3) Some of the causes of overfishing, 4) How fisheries regulations work, and 5) The benefits and costs of fisheries regulations.

Docs: GoFish_module_text.docx  West_coast_groundfish_template.pdf  intro.pdf   wrksht.docx   labwrksht.docx
Standards: HS-ESS3, Models, Cause and Effects, Systems
Keywords: cause communication economics fisheries HS-ESS3 math models natural resources systems tragedy of the commons

Tragedy of the Goldfish

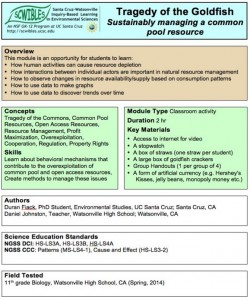
tragedy of the goldfishSustainably Managing a Common Pool Resource
by Duran Fiack and Dan Johnston

The tragedy of the commons is a dilemma when multiple individuals, acting independently, deplete a shared, limited resource. Articulating solutions to the tragedy of the commons is one of the main problems of environmental policy and natural resource managers. In the absence of enlightened self-interest, altruistic or cooperative behavior, some form of authority is needed to solve the collective action problem.

In this module, students represent independent actors seeking to catch fish to support their livelihood. Students learn: 1) How human activities can cause resource depletion, 2) How interactions between individual actors are important in natural resource management, and 3) How to use data to make graphs and to discover trends over time.

Docs: fullltext.docx   lecture.pptx   info.docx   handout1.docx
Keywords: cause, common pool resource, environmental policy, graphs, HS-LS3.A, HS-LS3.B, HS-LS4.A, natural resource, patterns

Native Plant Labels

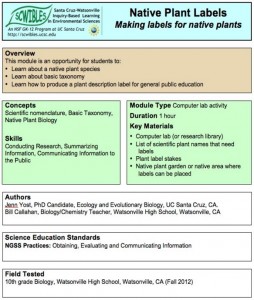
native plant labelsMaking Labels for Native Plants

by Jenn Yost and Bill Callahan

As described below in tne native plant garden module, one way to protect biodiversity is by restoring degraded habitats to more natural conditions. This process can be simulated at a school by creating a native plant garden. Native plant communities may also be studied in nearby protected areas. One way to expose students to local biodiversity and teach them the importance of biodiversity, is to learn about native plants and create native plant labels.

In this module, students research a native plant in their area and create their own native plant labels. These labels can be laminated and then attached to a stake that can be placed alongside the plant allowing others to identify and learn about local native plants.

Docs: fulltext.docx   intro.pptx   worksheet.docx   labels.doc
Keywords: communication, native plants, plant identification, restoration, school garden

Predict This!

predict this!

Using Models to Observe Correlation and Improve Predictions

by Caleb Bryce, Kim Goetz and Pablo Barrick

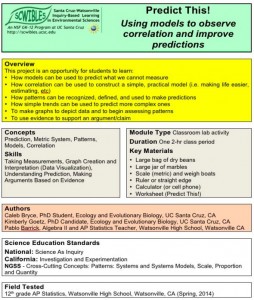
In this mini-activity, students measure the masses of specific numbers of beans and graph their data. From their graph they determine a linear model equation. Using their model, they predict the number of beans based on a given mass. The students are asked to create their own model for estimating the number of marbles in a large jar.

Students learn: 1) How to make graphs to depict data and to assess patterns; 2) How correlation can be used to construct a practical model; 3) How to use a model to predict what can not be easily measured; and 4) How to use evidence to support an argument.

Docs: fulltext.pdf
Keywords: argument, evidence, models, patterns, prediction, proportion, scale, systems

E-Literacy

E-LiteracyEvaluating Online Sources

by Elissa Olimpi, and Chrissy MacLean

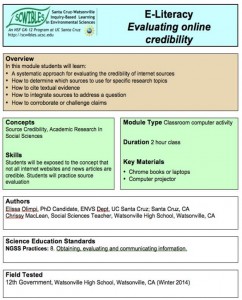
Students are faced with an overwhelming amount of information online and need to learn how to sift through available sources to find ones that are credible and appropriate for a specific research task. Many students have a basic understanding of the importance of evaluating sources, but have not practiced source evaluation. This lesson guides students through the process by highlighting questions that the student should ask of the source in order to decide if it is reliable.

Students learn: 1) A systematic approach for evaluating the credibility of internet sources 2) How to determine which sources to use for specific tasks, 3) How to cite textual evidence, and 4) How to corroborate or challenge claims.

Docs: fulltext.docx   intro.pptx   assessment.docx
Keywords: communication, evidence, sources


Says Who

says who.Deciphering a Scientific Article

by Hamutahl Cohen and Dan Johnston

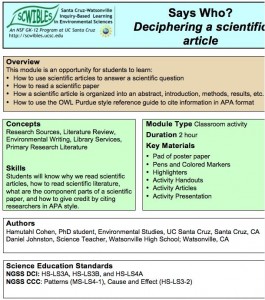
The goal of this module is to teach students how to read and understand scientific articles. This skill can be applied to answering a variety of research questions from different disciplines of science and engineering. The context for this inquiry is the impact of climate change on a species. Although climate change is the specific prompt used here, the prompt can be modified for different classroom topics and different courses.

Students learn: 1) How to read a scientific article, 2) How to use scientific articles to answer questions, and 3) How to cite information in APA format.

Docs: fulltext.docx   intro.ppt   handout.docx   pikas.pdf   bears.pdf   turtles.pdf
Keywords: APA citation, cause, climate change, communication, HS-ESS3.C, HS-LS2.A, scientific articles


Toxic Avengers

Featured

toxic avengersTools for Uncovering the Human Geography of Pollution
by Jenny Lovell and Dawn Krenz

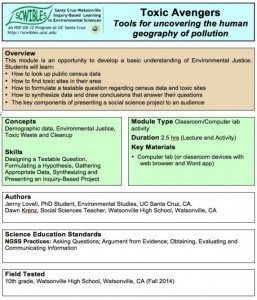
Environmental Justice (EJ) describes the trend of environmental impacts disproportionately affecting minority communities. It is a great subject to get students engaged about their neighborhoods and health. The Toxics Movement is closely related to EJ and shares the common interest of all people having the right to a clean and healthy environment.

Students learn: 1) How to look up public census data, 2) How to find toxic sites in their neighborhood, 3) How to formulate a testable question regarding census data and toxic sites, 4) How to synthesize data and draw conclusions that answer their questions, and 5) The key components of presenting a social science project to an audience.

Docs: fulltext.docx   presentation.pptx   activity.docx   checklist.docx
K
eywords: argument, cause, communication, data, environmental justice, mapping, questions, toxic sites


Go With the Flow

go with the flowThe Impact of Slope and Substrate on Water Flow Speed
by Catherine Wade and Will Federman

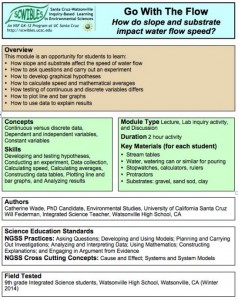
Water constantly cycles through the earth and the atmosphere. The study of water flow in streams and rivers and on impervious surfaces involves many variables. These include the slope or gradient of a stream, surface, or pipe and the type of substrate that water is flowing through. In this lab activity, students investigate how the speed of water flow changes with different slopes and different substrates.

Students learn: 1) How slope and substrate affect the speed of water flow, 2) How to ask questions, carry out an experiment and develop graphical hypotheses and 3) How to calculate speed and mathematical averages, and 4) How to plot line and bar graphs, and use data to explain results.

Docs: fulltext.docx   presentation.ppt   worksheet.docx
Keywords: argument, cause, data, erosion, HS-ESS2.C, explanations, graphs, hypothesis, investigations, math, models, questions, systems, water

Spinning Tops

spinning tops

Experiencing the Scientific Process

by Kristin deNesnera and Max Tarjan

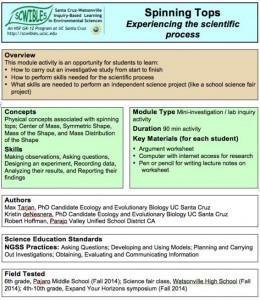
Independently planning and conducting investigations can be a daunting process for students. This module prepares students to carry out a study from beginning to end and to experience the feeling of ownership that makse the process more exciting. For students who are considering doing a science fair project, this mini-module will give them a better sense of their responsibilities as a science fair participant.

Students learn: 1) How to carry out an investigative study from start to finish, 2) How to perform skills needed for the scientific process and 3) What skills are needed to perform an independent science project (like a school science fair project).

Docs: fulltext.docx   StudentWorksheet.docx   TeacherTips.docx  Worksheet_Espanol.docx
Keywords: argument, cause, data, explanations, investigations, models, patterns, HS-PS2.A, questions, science fair, scientific process, structure

Native Plant Garden

native plant gardenAssessing Biodiversity Using a School Garden
by Jenn Yost, Carla Fresquez and Bill Callahan

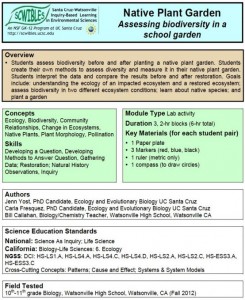
One way that we can protect biodiversity is by restoring degraded habitats to more natural conditions. This process can be simulated at a school through the restoration of a degraded plot of land into local native plant communities. Planting a native garden is a way to expose students to local biodiversity, teach them the importance of biodiversity, and mimic what can be done on a large scale to restore ecosystems once they are degraded.

Students 1) develop their own methods to quantify biodiversity, 2) measure biodiversity in a native garden, and 3) gain first hand experience in native plant gardens, restoration, and human impacts on environments.

Docs: fulltext.docx   lecture1.pdf   lecture2.pptx   handout.docx   datasetExs.xlsx   graphs.docx
Keywords: argument, biodiversity, cause, data, HS-ESS3.A, HS-ESS3.C, explanations, garden, investigations, HS-LS1.A, HS-LS2.A, HS-LS2.C, HS-LS4.A, HS-LS4.D, models, native plants, patterns, questions, restoration, systems

Land to Sea

land to seaSearching for the Source of Pollutants

by Max Tarjan and Will Federman

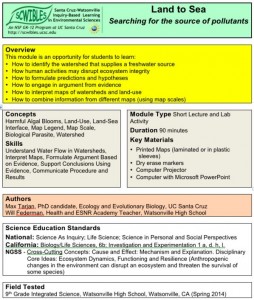
In this module students work in small groups with map-based data to learn about watersheds and to find a likely source of pollutants. After a short introduction, students work together to intrepret ther maps provided and to support an argument, stating where the pollutant is coming from, using the map data as evidence. The module provides all the supporting materials needed to run a 90 minute activity.

In this module, students learn: 1) How substances and organisms on land can affect ocean life, 2) How human activities may disrupt ecosystem integrity, to identify the watershed that supplies a river, 3) How to interpret maps of watersheds and land use, and 4) How to combine information from different maps using map scales, and 5) How to make estimates based on map data, and engage in argument from evidence.

Docs: fulltext.pdf   introlect.pdf   summarylect.pdf   handout.pdf   watersheds.pdf   landuse.pdf   seaotters.pdf   sealions.pdf
Keywords: argument, cause, communication, data, HS-ESS2.C, evidence, explanations, HS-LS2.A, HS-LS2.C, mapping, marine mammals, models, patterns, pollution, scale, systems, watersheds

Oil Pollution Solutions

oil pollution sollution

Oil Pollution in the Marine Environment

by Kristin deNesnera and Satina Ciandro

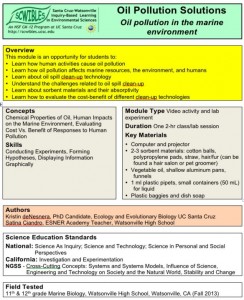
In this “hands-on” module, students learn about: sources of oil pollution in the marine environment; the effects of oil pollution on marine life, human health, and economies; examples of major oil spills; and the challenges involved in responding to and cleaning up an oil spill.

Students learn: 1) How human activities cause oil pollution, 2) How oil pollution affects marine resources, the environment, 3) About various oil spill clean-up technologies and sorbent materials absorptivity, and 4) About the challenges related to oil spill clean-up.

A video to accompany an inquiry based educational activity (module) used in the SCWIBLES program. Created by Kristin de Nesnera.

Docs: fulltext.pdf   lecture.pdf   activity.docx   costchart.docx
Keywords: clean up, data, engineering, HS-ESS3.A, HS-ESS3.C, HS-ETS1.C, HS-ETS2.B, explanations, investigations, marine, math, models, oil pollution, HS-PS1.A, questions, scale, stability, structure, systems

My Digital Watershed

my digital watershedAnalyzing Watersheds in Google Earth

by Tim Norris and Will Federman

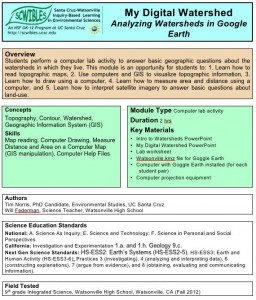
Students perform a computer lab activity to answer basic geographic questions about the watersheds in which they live. This module is an opportunity for students to: 1. Learn how to read topographic maps, 2. Use computers and GIS to visualize topographic information, 3. Learn how to draw using a computer, 4. Learn how to measure area and distance using a computer, and 5. Learn how to interpret satellite imagery to answer basic questions about land-use.

Docs: fulltext.docx   intro.pdf   help.pdf   lecture.pdf   worksheet.docx
Keywords: area, argument, communication, data, distance, HS-ESS3.A, HS-ESS3.C, HS-ETS1.A, explanations, GIS, Google Earth, investigations, mapping, scale, systems, watershed

The California Water Puzzle

the california water puzzleFreshwater Distribution Around California
by Tim Norris and Will Federman

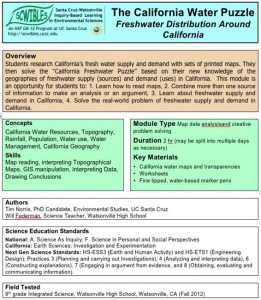
Students research California’s fresh water supply and demand with sets of printed maps. They then solve the “California Freshwater Puzzle” based on their new knowledge of the geographies of freshwater supply (sources) and demand (uses) in California. This module is an opportunity for students to: learn how to read different kinds of maps, combine more than one source of information to make an analysis or an argument, learn about freshwater supply and demand in California, and solve the real-world problem of freshwater supply and demand in California.

Docs: fulltext.doc   prompt.docx   worksheet.docx   maps.pdf
Keywords: argument, HS-ESS3, evidence, mapping, water

Environmental Science from Space

environmental science from space

Remote Sensing and the Electromagnetic Spectrum

by Kristin McCully and Jack Horner

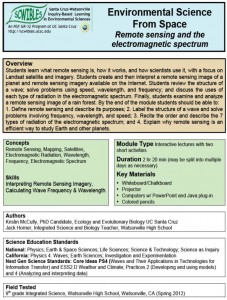
Students learn what remote sensing is, how it works, and how scientists use it, with a focus on Landsat satellite and imagery. They create, and then interpret, a remote sensing image of a planet and remote sensing imagery available on the Internet. Students review the structure of a wave; solve problems using speed, wavelength, and frequency; and discuss the uses of each type of radiation in the electromagnetic spectrum. Finally, students examine and analyze a remote sensing image of a rain forest.

Docs: fulltext.pdf   presentation.pdf   handout.doc   handoutkey.doc
Keywords: data, electromagnetic spectrum, HS-ESS2.D, HS-ETS1.A, explanations, iimagery, models, HS-PS4.A, HS-PS4.B, HS-PS4.C, rain forest, remote sensing, scale, systems

What’s Your Walk Score

what's your walk scoreWalkable Neighborhoods as Healthy, Social and Safe Communities

by Jeff Jenkins and Sarah Baumgart

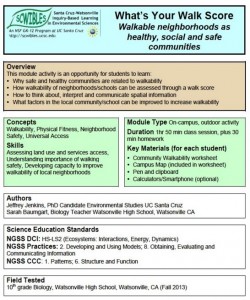
Students in low income communities are increasingly faced with poor nutrition and limited exercise options. One way to combat this is to teach about walkable communities. Teaching about walkable communities will also get students to think about land use in their own neighborhood, will make them more aware of their surroundings, and will provide direction for improving their communities.

Students learn: 1) Why safe and healthy communities are related to walkability, 2) How walkability of neighborhoods/schools can be assessed through a walk score, 3) How to think about, interpret, and communicate spatial information, and 4) What factors in their community can be improved to increase walkability.

Students, particular those in low income communities, are increasingly faced with poor nutrition and exercise options. One way to combat this while also building community is to teach about walkable communities.

Docs: fulltext.docx   worksheet.docx
Keywords: communication, community, health, HS-LS2.A, HS-LS2.D, models, patterns, structure, sustainability, urban design, walk score, walkability

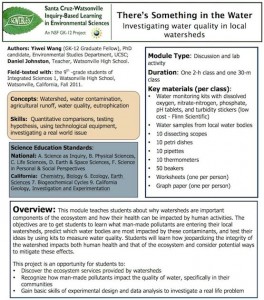
There’s Something in the Water

there's something in the waterInvestigating Water Quality in Local Watersheds

by Yiwei Wang and Dan Johnston

This module teaches students about why watersheds are important
components of the ecosystem and how their health can be impacted by human activities. The objectives are to get students to learn what man-made pollutants are entering their local watersheds, predict which water bodies are most impacted by these contaminants, and test their ideas by using kits to measure water quality. Students will learn how jeopardizing the integrity of the watershed impacts both human health and that of the ecosystem and consider potential ways to mitigate these effects.

Docs: fulltext.pdf   final.doc   handout.doc   handoutkey.doc
Keywords: data, ecosystem health, HS-ESS2.C, HS-ESS3.A, explanations, investigations, HS-LS2.C, models, pollution, water quality, watersheds

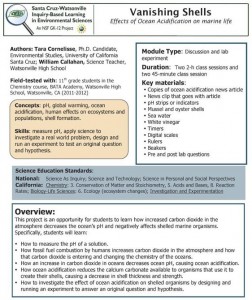
Vanishing Shells

vanishing shellsEffects of Ocean Acidification on Marine Life

by Tara Cornelisse and Bill Callahan

This project is an opportunity for students to learn how increased carbon dioxide in the atmosphere decreases the ocean’s pH and negatively affects shelled marine organisms. Students start with short informational videos and news readings, and then a real-life problem (an oyster business) as the context for designing questions, hypotheses, and investigating this phenomenon through hands-on experiments.

Docs: fulltext.pdf   labworksheet.pdf   labkey.pdf
Keywords: atmosphere, carbon dioxide, cause, data, HS-ESS3.C, HS-ESS3.D, explanations, investigations, marine, ocean acidification, oysters, pH, HS-PS1.B, questions, shells, stability, structure

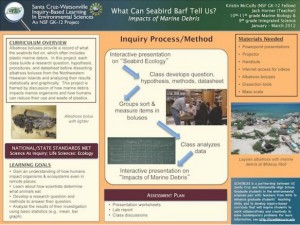
Learn From Seabird Barf

what can seabird barf tell us

Seabirds and Marine Debris

by Kristin McCully and Jack Horner

Albatross boluses provide a record of what the seabirds fed on, which often includes plastic marine debris. In this project, each class builds a research question, hypothesis, procedures, and datasheet before dissecting albatross boluses from the Northwestern Hawaiian Islands and analyzing their results statistically and graphically. This project is framed by discussion of how marine debris impacts marine organisms and how humans can reduce their use and waste of plastics.

Docs: Fulltext.pdf   Worksheet.pdf   Presentation.pdf
Keywords: albatross, data, HS-ESS3.C, explanations, investigations, HS-LS1.B, marine, marine debris, math, models, patterns, plastic, pollution, questions, seabirds, systems

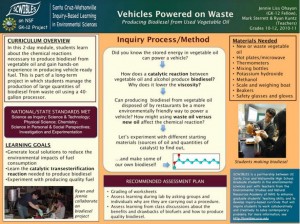
Vehicles Powered on Waste

vehicles powered on waste

Producing Biodiesel from Used Vegetable Oil

by Jennie Liss Ohayon, Mark Sterrett and Ryan Kuntz

In this lab, students learn how to think about what makes the energy in vegetable oil available to use for vehicle engines. They learn about the chemical reactions that produce biodiesel, and why these chemical reactions are needed to produce vehicle-ready fuel. They practice making biodiesel, and compare the results when they use different amounts of catalyst, and when they use either new or used vegetable oil.

Docs: fulltext.pdf
Keywords: biodiesel, catalyst, chemical reactions, data, energy, HS-ESS3.B, HS-ETS1.B, explanations, investigations, HS-PS3.A, HS-PS3.D, questions, structure, vegetable oil

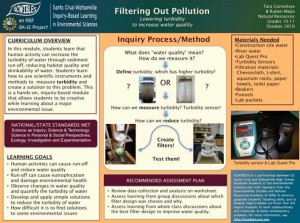
Filtering out Pollution

filtering out pollutionLowering Turbidity to Increase Water Quality

by Tara Cornelisse and Ruben Mejia

In this lab activity, students learn what turbidity is and how to measure it using a turbidity sensor connected to a data logger. Students then use an array of readily available materials to investigate how to build a water filter that efficiently reduces turbidity.

Docs: fulltext.pdf
Keywords: build, data, HS-ESS3.A, HS-ESS3.C, HS-ETS1.C, HS-ETS2.B, explanations, investigations, HS-PS1.A, questions, turbidity, water, water filter, water quality