Exit Poll DemoGRAPHics

Exit_poll_demoGRAPHicsCollecting, Graphing, and Interpreting Exit Poll Data

by Elissa Olimpi, Jenny Lovell and Chrissy MacLean

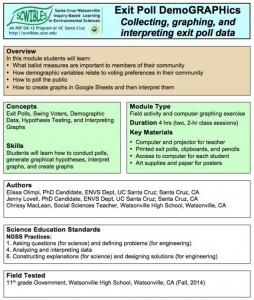
Exit polls are used to determine or predict what people believe, how they feel about something, or in what way they will act. This module is designed to lead students through the process of designing an exit poll to answer a hypothesis about a local, state, or national election. The data they collect can be compiled and analyzed as if the poll were being presented on the news. In this way, students can gain a deeper understanding of one part of the legislative process.

Students learn: 1) What ballot measures are important to members of their community 2) How to poll the public, 3) How to generate graphical hypotheses and 4) How to create graphs in Google Sheets and interpret them.

Docs: fulltext.docx   form.docx   organizer.docx
Keywords: community, data, explanations, graphs, hypothesis, polling, questions

Are You My Sister

Sister moduleBuilding Trees to Understand Evolutionary Relationships

by Ben Higgins and Satina Ciandro

How do students begin to make sense of the vast diversity of life?  Even when exposed to just a sliver of such diversity, it is commonplace for students to become disengaged.  This module is a first step in understanding why and how animals are classified and to become excited about the process.

The purpose of this module is to use the traits that each species possess to develop an understanding of species relatedness.  Upon completion of this module, students should have a better understanding of why assemblages of animals are classified together. This module is an opportunity for students to learn: 1) How organisms are grouped together and 2) How to interpret relationships among groups of organisms.

Docs: sequences.docx   cards.pdf
Keywords: argument, cause, data, evolutionary trees, explanations, HS-LS3.B, HS-LS3.A, HS-LS3.B, HS-LS4.A, investigations, models, MS-LS4.A, patterns, phylogenetics, traits

Solving Crimes with Chemistry

Solving Crimes with ChemistryThe Case of the Missing Balance

by Chandra Goetsch, Rachel Zuercher, Ruth Herradora, and Burnne Yew

Many specialty fields use a variety of scientific techniques to answer questions and/or solve problems. For example, forensic scientists collect different pieces of evidence from a crime scene. This module encourages students to choose which methods are appropriate to test the evidence. After conducting the appropriate chemical tests, the students conclude which suspect committed the crime.

Students learn: 1) How chemical testing is used to identify unknown substances, 2) How to collect data from a series of experiments, and 3) How to record and interpret data and make conclusions based on gathered evidence.

Docs: fulltext.docx   presentation.pptx   teacherguide.docx   studentguide.docx   worksheet.docx   chemref.docx   bios.docx   report.docx
Keywords: argument, cause, chemical tests, communication, crime, data, evidence, explanations, forensic science, investigations, patterns, HS-PS1.A

Colors in Chemistry

colors in chemistryUsing Paper Chromatography to Understand Polarity

by Chandra Goetsch, Rachel Zuercher, Ruth Herradora, and Burnne Yew

It’s difficult for students to understand some chemistry concepts, such as polarity, without being able to see a molecule. This module visually shows students the difference between polar and nonpolar substances. It helps students understand separation chemistry and gives them a background to understanding other chromatography techniques.

Students learn: 1) How chromatography helps scientists test the components of different mixtures, 2) How solubility of polar and nonpolar substances differ depending on the solvent, and 3) How to collect data during an experiment.

A SCWIBLES video to accompany our hands-on inquiry-based module on paper chromatography developed by Fellows Rachel Zuercher and Chandra Goetsch.


Docs: fulltext.docx   presentation.pptx   worksheet.docx
Keywords: chromatography, data, explanations, investigations, patterns, polarity, HS-PS1.A


Go With the Flow

go with the flow
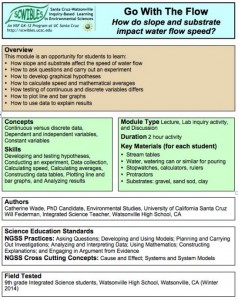
The Impact of Slope and Substrate on Water Flow Speed

by Catherine Wade and Will Federman

Water constantly cycles through the earth and the atmosphere. The study of water flow in streams and rivers and on impervious surfaces involves many variables. These include the slope or gradient of a stream, surface, or pipe and the type of substrate that water is flowing through. In this lab activity, students investigate how the speed of water flow changes with different slopes and different substrates.

Students learn: 1) How slope and substrate affect the speed of water flow, 2) How to ask questions, carry out an experiment and develop graphical hypotheses and 3) How to calculate speed and mathematical averages, and 4) How to plot line and bar graphs, and use data to explain results.

Docs: fulltext.docx   presentation.ppt   worksheet.docx
Keywords: argument, cause, data, erosion, HS-ESS2.C, explanations, graphs, hypothesis, investigations, math, models, questions, systems, water

Spinning Tops

spinning tops

Experiencing the Scientific Process

by Kristin deNesnera and Max Tarjan

Independently planning and conducting investigations can be a daunting process for students. This module prepares students to carry out a study from beginning to end and to experience the feeling of ownership that makse the process more exciting. For students who are considering doing a science fair project, this mini-module will give them a better sense of their responsibilities as a science fair participant.

Students learn: 1) How to carry out an investigative study from start to finish, 2) How to perform skills needed for the scientific process and 3) What skills are needed to perform an independent science project (like a school science fair project).

Docs: fulltext.docx   StudentWorksheet.docx   TeacherTips.docx  Worksheet_Espanol.docx
Keywords: argument, cause, data, explanations, investigations, models, patterns, HS-PS2.A, questions, science fair, scientific process, structure

Native Plant Garden

native plant garden
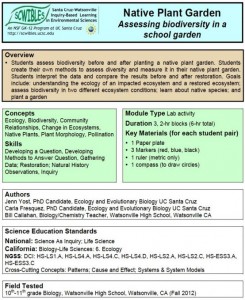
Assessing Biodiversity Using a School Garden

by Jenn Yost, Carla Fresquez and Bill Callahan

One way that we can protect biodiversity is by restoring degraded habitats to more natural conditions. This process can be simulated at a school through the restoration of a degraded plot of land into local native plant communities. Planting a native garden is a way to expose students to local biodiversity, teach them the importance of biodiversity, and mimic what can be done on a large scale to restore ecosystems once they are degraded.

Students 1) develop their own methods to quantify biodiversity, 2) measure biodiversity in a native garden, and 3) gain first hand experience in native plant gardens, restoration, and human impacts on environments.

Docs: fulltext.docx   lecture1.pdf   lecture2.pptx   handout.docx   datasetExs.xlsx   graphs.docx
Keywords: argument, biodiversity, cause, data, HS-ESS3.A, HS-ESS3.C, explanations, garden, investigations, HS-LS1.A, HS-LS2.A, HS-LS2.C, HS-LS4.A, HS-LS4.D, models, native plants, patterns, questions, restoration, systems

Land to Sea

land to seaSearching for the Source of Pollutants

by Max Tarjan and Will Federman

In this module students work in small groups with map-based data to learn about watersheds and to find a likely source of pollutants. After a short introduction, students work together to intrepret ther maps provided and to support an argument, stating where the pollutant is coming from, using the map data as evidence. The module provides all the supporting materials needed to run a 90 minute activity.

In this module, students learn: 1) How substances and organisms on land can affect ocean life, 2) How human activities may disrupt ecosystem integrity, to identify the watershed that supplies a river, 3) How to interpret maps of watersheds and land use, and 4) How to combine information from different maps using map scales, and 5) How to make estimates based on map data, and engage in argument from evidence.

Docs: fulltext.pdf   introlect.pdf   summarylect.pdf   handout.pdf   watersheds.pdf   landuse.pdf   seaotters.pdf   sealions.pdf
Keywords: argument, cause, communication, data, HS-ESS2.C, evidence, explanations, HS-LS2.A, HS-LS2.C, mapping, marine mammals, models, patterns, pollution, scale, systems, watersheds

Oil Pollution Solutions

oil pollution sollution

Oil Pollution in the Marine Environment

by Kristin deNesnera and Satina Ciandro

In this “hands-on” module, students learn about: sources of oil pollution in the marine environment; the effects of oil pollution on marine life, human health, and economies; examples of major oil spills; and the challenges involved in responding to and cleaning up an oil spill.

Students learn: 1) How human activities cause oil pollution, 2) How oil pollution affects marine resources, the environment, 3) About various oil spill clean-up technologies and sorbent materials absorptivity, and 4) About the challenges related to oil spill clean-up.

A video to accompany an inquiry based educational activity (module) used in the SCWIBLES program. Created by Kristin de Nesnera.

Docs: fulltext.pdf   lecture.pdf   activity.docx   costchart.docx
Keywords: clean up, data, engineering, HS-ESS3.A, HS-ESS3.C, HS-ETS1.C, HS-ETS2.B, explanations, investigations, marine, math, models, oil pollution, HS-PS1.A, questions, scale, stability, structure, systems

What’s Stomata With You?

what's stomata with you
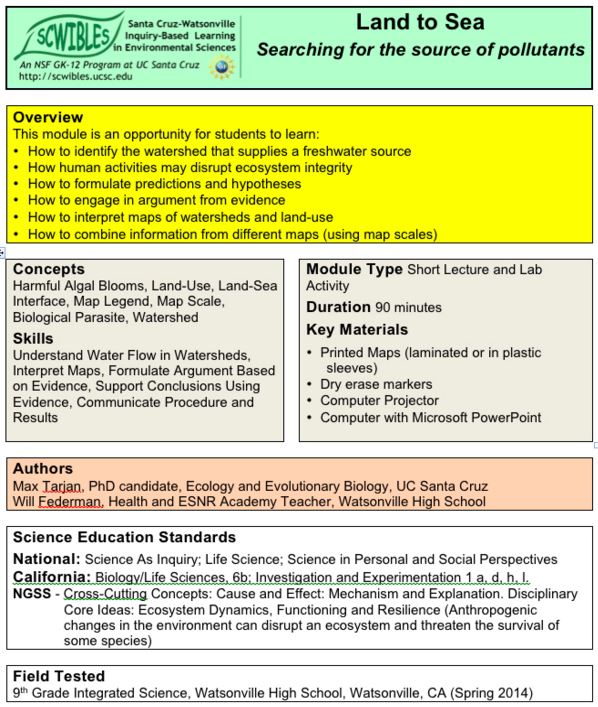
Using Leaf Epidermal Peels to Determine Stomatal Density

by Catherine Wade and William Callahan

This module provides an opportunity for students to observe leaf stomata and make predictions about interactions between plants and environmental conditions. After introducing students to the basic form and function of stomata and discussing photosynthesis and transpiration, students will hypothesize about the distribution of stomata on the upper and lower leaf surfaces. Then, they make wet mount slides of leaf epidermal peels to view stomata under a microscope and calculate average stomatal densities for the top and bottom of the leaf.

Fellow Catherine Wade produced this video to explain the concepts behind leaf stomata and their importance in regulating water loss in plants.

Docs: fulltext.docx   worksheet.docx
Keywords: argument, communication, data, explanations, investigations, HS-LS1.A, HS-LS1.C, math, plants, prediction, questions, stability, stomata, structure, transpiration

My Digital Watershed

my digital watershedAnalyzing Watersheds in Google Earth

by Tim Norris and Will Federman

Students perform a computer lab activity to answer basic geographic questions about the watersheds in which they live. This module is an opportunity for students to: 1. Learn how to read topographic maps, 2. Use computers and GIS to visualize topographic information, 3. Learn how to draw using a computer, 4. Learn how to measure area and distance using a computer, and 5. Learn how to interpret satellite imagery to answer basic questions about land-use.

Docs: fulltext.docx   intro.pdf   help.pdf   lecture.pdf   worksheet.docx
Keywords: area, argument, communication, data, distance, HS-ESS3.A, HS-ESS3.C, HS-ETS1.A, explanations, GIS, Google Earth, investigations, mapping, scale, systems, watershed

Environmental Science from Space

environmental science from space

Remote Sensing and the Electromagnetic Spectrum

by Kristin McCully and Jack Horner

Students learn what remote sensing is, how it works, and how scientists use it, with a focus on Landsat satellite and imagery. They create, and then interpret, a remote sensing image of a planet and remote sensing imagery available on the Internet. Students review the structure of a wave; solve problems using speed, wavelength, and frequency; and discuss the uses of each type of radiation in the electromagnetic spectrum. Finally, students examine and analyze a remote sensing image of a rain forest.

Docs: fulltext.pdf   presentation.pdf   handout.doc   handoutkey.doc
Keywords: data, electromagnetic spectrum, HS-ESS2.D, HS-ETS1.A, explanations, iimagery, models, HS-PS4.A, HS-PS4.B, HS-PS4.C, rain forest, remote sensing, scale, systems

A Matter of Human Proportions

a matter of human proportionsAre You Vitruvian?

by Vikram Baliga and Sarah Baumgart

This module is an opportunity for students to learn: 1) How to use the metric system to measure linear distances; 2) Whether proportions that exist between parts of the human body are consistent across individuals; and 3) How to form a hypothesis, analyze data, and argue whether evidence supports the hypothesis.
Docs: fulltext.docx   metric.pdf   worksheet.docx   instructions.docx   handout.pdf   stats.pdf
Keywords: argument, communication, data, evidence, explanations, human anatomy, hypothesis, investigations, HS-LS1.A, HS-LS1.B, HS-LS3.B, math, models, patterns, proportions, questions, structure, systems, vitruvian man

Contour What?

contour whatby Timothy Norris and Will Federman

This modules is designed as an introduction to understanding topographic maps and GIS using Google Earth. Students perform a computer lab activity to learn how to read topographic maps, measure geographical features, and use geographic information systems (GIS).

Docs: fulltext.docx   lab.pdf   lecture.pdf
Keywords: argument, communication, contour, data, HS-ESS3.A, HS-ESS3.C, HS-ETS1.B, HS-ETS1.C, explanations, GIS, Google Earth, investigations, mapping, patterns, scale, systems

Otters and Urchins

otters and urchinsEcology of The Kelp Forest

by Kristin McCully and Jack Horner

This multi-week modules is designed as a general introduction to ecology as a science, while exploring the excitement of the charismatic kelp forest ecosystem. It introduces the fields of population, community, ecosystem, and conservation ecology, and helps build skills in using equations, creating graphs, interpreting maps, and modeling ecological systems.

Docs: poplecture.pdf   ecolecture.pdf   commlecture.pdf   introlecture.pdf   conslecture.pdf   worksheets.doc   worksheetskey.pdf   studyguide.pdf   studyguidekey.pdf
Keywords: communication, data, ecosystem, explanations, graphs, kelp forest, HS-LS1.C, HS-LS2.A, HS-LS2.B, HS-LS2.C, marine food web, marine science, math, otters, patterns, scale, stability, systems, urchins

There’s Something in the Water

there's something in the waterInvestigating Water Quality in Local Watersheds

by Yiwei Wang and Dan Johnston

This module teaches students about why watersheds are important
components of the ecosystem and how their health can be impacted by human activities. The objectives are to get students to learn what man-made pollutants are entering their local watersheds, predict which water bodies are most impacted by these contaminants, and test their ideas by using kits to measure water quality. Students will learn how jeopardizing the integrity of the watershed impacts both human health and that of the ecosystem and consider potential ways to mitigate these effects.

Docs: fulltext.pdf   final.doc   handout.doc   handoutkey.doc
Keywords: data, ecosystem health, HS-ESS2.C, HS-ESS3.A, explanations, investigations, HS-LS2.C, models, pollution, water quality, watersheds

Observing Animals

observing animalsOrganizing and Recording Observations on the Animals All Around Us

by Joe Sapp and Don Brown

This project encourages students to think about how they recognize and classify things they observe in nature, using local insects as a model. Students are asked to identify insects from their area and to think about how exactly they are able to tell them apart. They draw the insects, list any names they might know for them, and learn what defines them as insects. In the process, they learn the basics of insect biology and how to make meaningful scientific observations about the natural world.

Docs: fulltext.pdf   insect.pdf   glossary.pdf   labels.pdf   worksheet.pdf
Keywords: animals, classification, communication, eta, explanations, insects, HS-LS1.B, HS-LS4.A, observation, patterns

Vanishing Shells

vanishing shellsEffects of Ocean Acidification on Marine Life

by Tara Cornelisse and Bill Callahan

This project is an opportunity for students to learn how increased carbon dioxide in the atmosphere decreases the ocean’s pH and negatively affects shelled marine organisms. Students start with short informational videos and news readings, and then a real-life problem (an oyster business) as the context for designing questions, hypotheses, and investigating this phenomenon through hands-on experiments.

Docs: fulltext.pdf   labworksheet.pdf   labkey.pdf
Keywords: atmosphere, carbon dioxide, cause, data, HS-ESS3.C, HS-ESS3.D, explanations, investigations, marine, ocean acidification, oysters, pH, HS-PS1.B, questions, shells, stability, structure

Learn From Seabird Barf

what can seabird barf tell us

Seabirds and Marine Debris

by Kristin McCully and Jack Horner

Albatross boluses provide a record of what the seabirds fed on, which often includes plastic marine debris. In this project, each class builds a research question, hypothesis, procedures, and datasheet before dissecting albatross boluses from the Northwestern Hawaiian Islands and analyzing their results statistically and graphically. This project is framed by discussion of how marine debris impacts marine organisms and how humans can reduce their use and waste of plastics.

Docs: Fulltext.pdf   Worksheet.pdf   Presentation.pdf
Keywords: albatross, data, HS-ESS3.C, explanations, investigations, HS-LS1.B, marine, marine debris, math, models, patterns, plastic, pollution, questions, seabirds, systems

Rocks Rock!

Rocks rock
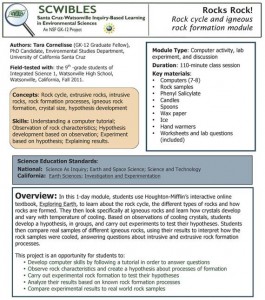
Rock cycle and igneous rock formation

by Tara Cornelisse

In this 1-day module, students use Houghton-Mifflin’s interactive online textbook, Exploring Earth, to learn about the rock cycle, the different types of rocks and how rocks are formed. They then look specifically at igneous rocks and learn how crystals develop and vary with temperature of cooling. Based on observations of cooling crystals, students develop a hypothesis, in groups, and carry out experiments to test their hypotheses. Students then compare real samples of different igneous rocks, using their results to interpret how the rock samples were cooled, answering questions about intrusive and extrusive rock formation processes.

Docs: Fulltext.pdf   RockLab.pdf   IgneousLab.pdf   IgneousKey.pdf
Keywords: data, HS-ESS3.A, explanations, geology, igneous, investigations, patterns, HS-PS1.A, questions, rock cycle, rock formation, rocks, structure

Why Do Organisms Vary?

why do organisms varyGenetic and Environmental Contributions to Trait Variation

by Beth Bastiaans and Ryan Kuntz

In this 2-month project, students design an experiment to assess phenotypic variation in one or more traits. Students use Wisconsin Fast PlantsTM (Brassica rapa). In a breeding experiment, they select a trait and analyze it during two generations of plants. Students create a pedigree by cross-pollinating the first generation with those of other students to generate a second generation of seeds with known parentage. They use linear regression to measure similarity of the selected trait in both generations. The second experiment begins with the offspring generation: students select an environmental variable, and plant enough of those offspring seeds to control that variable, again measuring the selected trait, and using linear regression to analyze effectiveness of that environmental factor.

Docs: Fulltext.pdf
Keywords: argument, data, HS-ETS2.B, explanations, genetic traits, investigations, HS-LS1.B, HS-LS3.A, HS-LS3.B, HS-LS4.B, math, organisms, phenotype, questions, variation

Roadkill Reduction with GIS

road-kill reduction with GIS

Learning to Use Layers

by Beth Bastiaans and Dan Johnston

What factors influence roadkill densities on our streets and highways? What steps can we take to protect wildlife? In this 2-hour module, students use Google Earth to learn how Geographical Information Systems (GIS) technology can help solve environmental problems. They also develop and test their own original hypotheses about roadkill, a familiar, local environmental issue. By combining multiple GIS layers in Google Earth, students develop and test hypotheses about which other landscape features may be correlated with roadkill frequency. Finally, the students discuss the difference between correlation and causation and what factors might bias their analyses.

Docs: Fulltext.pdf
Keywords: argument, causation, cause, communication, correlation, data, HS-ESS3.C, HS-ETS2.A, HS-ETS2.B, explanations, GIS, investigations, layers, math, patterns, questions, roadkill, systems

Energy for Change

energy for changeGreen Energy Audit

by Jennie Liss Ohayon and Dan Johnston

Students and teachers can use parts or all of our step-by-step workbook to conduct an energy audit of their school. The whole module is designed to strengthen students’ understanding of concepts in physics such as power and energy by making real-world connections, and by using appropriate technology to inquire into their own environment (particularly the lighting systems of their school). They calculate potential energy savings from both behavioral (e.g., turning lights off) and operational (e.g., retrofits) measures. Finally, students synthesize their data and develop specific recommendations for administrators or the public.

Docs: Fulltext.pdf   Workbook.pdf
Keywords: data, energy, energy savings, explanations, green energy, investigations, math, power, HS-PS3.A, HS-PS4.C, questions

The Road to Sustainability

the road to sustainability

Closing the Loop by Achieving Zero Waste

by Tara Cornelisse

Students learn that the products they own go through a materials economy that includes natural resource extraction, production, distribution and themselves as consumers and disposers. Learning that this is unsustainable, students do a waste characterization of school trash and calculate the percent of trash that can be diverted from landfills with the goal of zero waste.

Docs: Full text.pdf
Keywords: data, HS-ESS3.A, HS-ESS3.C, explanations, investigations, life cycle analysis, math, patterns, questions, sustainability, systems, zero waste

Vehicles Powered on Waste

vehicles powered on waste

Producing Biodiesel from Used Vegetable Oil

by Jennie Liss Ohayon, Mark Sterrett and Ryan Kuntz

In this lab, students learn how to think about what makes the energy in vegetable oil available to use for vehicle engines. They learn about the chemical reactions that produce biodiesel, and why these chemical reactions are needed to produce vehicle-ready fuel. They practice making biodiesel, and compare the results when they use different amounts of catalyst, and when they use either new or used vegetable oil.

Docs: fulltext.pdf
Keywords: biodiesel, catalyst, chemical reactions, data, energy, HS-ESS3.B, HS-ETS1.B, explanations, investigations, HS-PS3.A, HS-PS3.D, questions, structure, vegetable oil

Filtering out Pollution

filtering out pollutionLowering Turbidity to Increase Water Quality

by Tara Cornelisse and Ruben Mejia

In this lab activity, students learn what turbidity is and how to measure it using a turbidity sensor connected to a data logger. Students then use an array of readily available materials to investigate how to build a water filter that efficiently reduces turbidity.

Docs: fulltext.pdf
Keywords: build, data, HS-ESS3.A, HS-ESS3.C, HS-ETS1.C, HS-ETS2.B, explanations, investigations, HS-PS1.A, questions, turbidity, water, water filter, water quality