Gender Bender

Gender_BenderHow the Media Influences Our Gender Perceptions

By Jenny Lovell

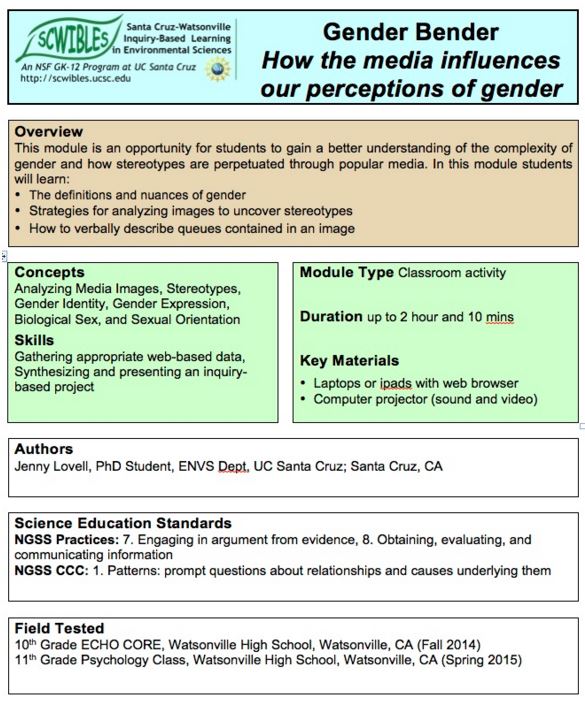
Gender is a relevant and contentious topic that is constantly reinforced through non-verbal queues in the media. LGBTQA (lesbian, gay, bisexual, transgender, queer, and questioning) issues are hotly debated in schools, courts, and public media venues. While most people think of gender as a simple binary (i.e. man or woman), gender is a complex and delicate continuum that includes many aspects that are not often discussed.

In this module, students will gain a better understanding of the complexity of gender and how stereotypes are perpetuated through popular media. By the end of the lesson students will learn: 1) The definitions and nuances of gender, 2) Strategies for analyzing images to uncover stereotypes and 3) How to verbally describe non-verbal queues contained in an image.

Docs: fulltext.docx   intro.pdf   activity.docx
K
eywords: argument, communication, gender, image analysis, LGBTQA, media, patterns, stereotypes

Predict This!

predict this!

Using Models to Observe Correlation and Improve Predictions

by Caleb Bryce, Kim Goetz and Pablo Barrick

In this mini-activity, students measure the masses of specific numbers of beans and graph their data. From their graph they determine a linear model equation. Using their model, they predict the number of beans based on a given mass. The students are asked to create their own model for estimating the number of marbles in a large jar.

Students learn: 1) How to make graphs to depict data and to assess patterns; 2) How correlation can be used to construct a practical model; 3) How to use a model to predict what can not be easily measured; and 4) How to use evidence to support an argument.

Docs: fulltext.pdf
Keywords: argument, evidence, models, patterns, prediction, proportion, scale, systems

Are You My Sister

Sister moduleBuilding Trees to Understand Evolutionary Relationships

by Ben Higgins and Satina Ciandro

How do students begin to make sense of the vast diversity of life?  Even when exposed to just a sliver of such diversity, it is commonplace for students to become disengaged.  This module is a first step in understanding why and how animals are classified and to become excited about the process.

The purpose of this module is to use the traits that each species possess to develop an understanding of species relatedness.  Upon completion of this module, students should have a better understanding of why assemblages of animals are classified together. This module is an opportunity for students to learn: 1) How organisms are grouped together and 2) How to interpret relationships among groups of organisms.

Docs: sequences.docx   cards.pdf
Keywords: argument, cause, data, evolutionary trees, explanations, HS-LS3.B, HS-LS3.A, HS-LS3.B, HS-LS4.A, investigations, models, MS-LS4.A, patterns, phylogenetics, traits

Solving Crimes with Chemistry

Solving Crimes with ChemistryThe Case of the Missing Balance

by Chandra Goetsch, Rachel Zuercher, Ruth Herradora, and Burnne Yew

Many specialty fields use a variety of scientific techniques to answer questions and/or solve problems. For example, forensic scientists collect different pieces of evidence from a crime scene. This module encourages students to choose which methods are appropriate to test the evidence. After conducting the appropriate chemical tests, the students conclude which suspect committed the crime.

Students learn: 1) How chemical testing is used to identify unknown substances, 2) How to collect data from a series of experiments, and 3) How to record and interpret data and make conclusions based on gathered evidence.

Docs: fulltext.docx   presentation.pptx   teacherguide.docx   studentguide.docx   worksheet.docx   chemref.docx   bios.docx   report.docx
Keywords: argument, cause, chemical tests, communication, crime, data, evidence, explanations, forensic science, investigations, patterns, HS-PS1.A

Round & Round It Goes

round and round it goesGetting Dizzy in Geosynchronous Orbit

by Caleb Bryce and Stephen Buchter

Some satellites “hover” over one place on the earth’s surface – a geosynchronous orbit. This module introduces students to the physics behind geosynchronous orbits. Students work together to find the relationship between the radius and the velocity of an object in circular motion. They graph their data and calculate the gravitational force needed to keep a satellite in geosynchronous orbit.

Students learn: 1) How circular motion is critical for satellites to stay in orbit, 2) How velocity and mass of an object in circular motion are related, and 4) How to use a graphical hypothesis to make predictions, interpret data, and create an argument from evidence.

A SCWIBLES video used as an intro to the Geosynchronous Orbit module created by Caleb Bryce and Stephen Buchter.

Docs: fulltext.docx   lecture.pptx   prequiz.pptx   quiz.pptx   quizkey.pptx   vandrlect.pptx
Keywords: argument, cause, data, geosynchronous, investigations, math, models, patterns, HS-PS2.A, HS-PS2.B, radius, systems, velocity


Toxic Avengers

Featured

toxic avengers
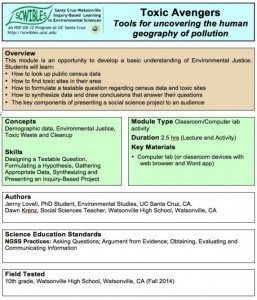
Tools for Uncovering the Human Geography of Pollution

by Jenny Lovell and Dawn Krenz

Environmental Justice (EJ) describes the trend of environmental impacts disproportionately affecting minority communities. It is a great subject to get students engaged about their neighborhoods and health. The Toxics Movement is closely related to EJ and shares the common interest of all people having the right to a clean and healthy environment.

Students learn: 1) How to look up public census data, 2) How to find toxic sites in their neighborhood, 3) How to formulate a testable question regarding census data and toxic sites, 4) How to synthesize data and draw conclusions that answer their questions, and 5) The key components of presenting a social science project to an audience.

Docs: fulltext.docx   presentation.pptx   activity.docx   checklist.docx
K
eywords: argument, cause, communication, data, environmental justice, mapping, questions, toxic sites


Go With the Flow

go with the flow
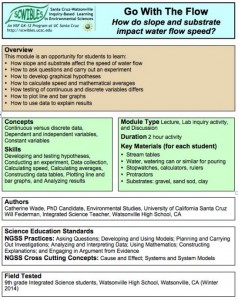
The Impact of Slope and Substrate on Water Flow Speed

by Catherine Wade and Will Federman

Water constantly cycles through the earth and the atmosphere. The study of water flow in streams and rivers and on impervious surfaces involves many variables. These include the slope or gradient of a stream, surface, or pipe and the type of substrate that water is flowing through. In this lab activity, students investigate how the speed of water flow changes with different slopes and different substrates.

Students learn: 1) How slope and substrate affect the speed of water flow, 2) How to ask questions, carry out an experiment and develop graphical hypotheses and 3) How to calculate speed and mathematical averages, and 4) How to plot line and bar graphs, and use data to explain results.

Docs: fulltext.docx   presentation.ppt   worksheet.docx
Keywords: argument, cause, data, erosion, HS-ESS2.C, explanations, graphs, hypothesis, investigations, math, models, questions, systems, water

Spinning Tops

spinning tops

Experiencing the Scientific Process

by Kristin deNesnera and Max Tarjan

Independently planning and conducting investigations can be a daunting process for students. This module prepares students to carry out a study from beginning to end and to experience the feeling of ownership that makse the process more exciting. For students who are considering doing a science fair project, this mini-module will give them a better sense of their responsibilities as a science fair participant.

Students learn: 1) How to carry out an investigative study from start to finish, 2) How to perform skills needed for the scientific process and 3) What skills are needed to perform an independent science project (like a school science fair project).

Docs: fulltext.docx   StudentWorksheet.docx   TeacherTips.docx  Worksheet_Espanol.docx
Keywords: argument, cause, data, explanations, investigations, models, patterns, HS-PS2.A, questions, science fair, scientific process, structure

Native Plant Garden

native plant gardenAssessing Biodiversity Using a School Garden

by Jenn Yost, Carla Fresquez and Bill Callahan

One way that we can protect biodiversity is by restoring degraded habitats to more natural conditions. This process can be simulated at a school through the restoration of a degraded plot of land into local native plant communities. Planting a native garden is a way to expose students to local biodiversity, teach them the importance of biodiversity, and mimic what can be done on a large scale to restore ecosystems once they are degraded.

Students 1) develop their own methods to quantify biodiversity, 2) measure biodiversity in a native garden, and 3) gain first hand experience in native plant gardens, restoration, and human impacts on environments.

Docs: fulltext.docx   lecture1.pdf   lecture2.pptx   handout.docx   datasetExs.xlsx   graphs.docx
Keywords: argument, biodiversity, cause, data, HS-ESS3.A, HS-ESS3.C, explanations, garden, investigations, HS-LS1.A, HS-LS2.A, HS-LS2.C, HS-LS4.A, HS-LS4.D, models, native plants, patterns, questions, restoration, systems

Splitting Atoms

splitting atoms
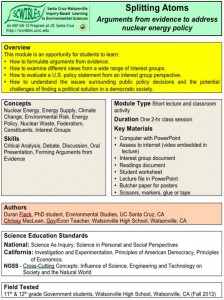
Arguments From Evidence to Address Nuclear Energy Policy

by Duran Fiack and Chrissy MacLean

In this module students represent the views of an interest group that either supports or opposes the expansion of nuclear-generated energy in the U.S. Students learn about the source of energy within the U.S. with a focus on the potential benefits and risks associated with expansion of nuclear energy.

In this module, students learn: How to formulate arguments from evidence, how to examine different views from a range of interest groups, how to evaluate a U.S. policy statement from an interest group perspective. Students will also learn how to understand the issues surrounding public policy decisions and the potential challenges of finding a political solution in a democratic society.

Docs: fulltext.pdf   intro.pdf   reading.pdf   groupnames.pdf   worksheet.pdf
Keywords: argument, cause, communication, HS-ESS3.A, HS-ESS3.C, HS-ESS3.D, evidence, nuclear energy, policy, scale

Land to Sea

land to seaSearching for the Source of Pollutants

by Max Tarjan and Will Federman

In this module students work in small groups with map-based data to learn about watersheds and to find a likely source of pollutants. After a short introduction, students work together to intrepret ther maps provided and to support an argument, stating where the pollutant is coming from, using the map data as evidence. The module provides all the supporting materials needed to run a 90 minute activity.

In this module, students learn: 1) How substances and organisms on land can affect ocean life, 2) How human activities may disrupt ecosystem integrity, to identify the watershed that supplies a river, 3) How to interpret maps of watersheds and land use, and 4) How to combine information from different maps using map scales, and 5) How to make estimates based on map data, and engage in argument from evidence.

Docs: fulltext.pdf   introlect.pdf   summarylect.pdf   handout.pdf   watersheds.pdf   landuse.pdf   seaotters.pdf   sealions.pdf
Keywords: argument, cause, communication, data, HS-ESS2.C, evidence, explanations, HS-LS2.A, HS-LS2.C, mapping, marine mammals, models, patterns, pollution, scale, systems, watersheds

Top Carnivore

top carnivoreTrophic Cascades and Predator-Prey Dynamics

by Veronica Yovovich and Dan Johnston

This module presents a “game” activity in which students learn about trophic cascades and how the different elements of a food chain interact. The module explores the importance of top-down regulation and how predators may regulate the habitats in which they live.

In this module, students learn: 1) How predators and prey interact, 2) How human activities may disrupt ecosystem integrity, 3) How to formulate predictions and hypotheses, 4) How to engage in argument from evidence, make and interpret simple graphs, and make estimates based on data they collect.

Docs: fulltext.pdf   handout.pdf   homework.pdf   cards.pdf
Keywords: argument, cause, data, evidence, food web, graphs, HS-LS2.A, HS-LS2.C, math, models, predators, prey, stability, systems, trophic cascades

What’s Stomata With You?

what's stomata with youUsing Leaf Epidermal Peels to Determine Stomatal Density

by Catherine Wade and William Callahan

This module provides an opportunity for students to observe leaf stomata and make predictions about interactions between plants and environmental conditions. After introducing students to the basic form and function of stomata and discussing photosynthesis and transpiration, students will hypothesize about the distribution of stomata on the upper and lower leaf surfaces. Then, they make wet mount slides of leaf epidermal peels to view stomata under a microscope and calculate average stomatal densities for the top and bottom of the leaf.

Fellow Catherine Wade produced this video to explain the concepts behind leaf stomata and their importance in regulating water loss in plants.

Docs: fulltext.docx   worksheet.docx
Keywords: argument, communication, data, explanations, investigations, HS-LS1.A, HS-LS1.C, math, plants, prediction, questions, stability, stomata, structure, transpiration

My Digital Watershed

my digital watershedAnalyzing Watersheds in Google Earth

by Tim Norris and Will Federman

Students perform a computer lab activity to answer basic geographic questions about the watersheds in which they live. This module is an opportunity for students to: 1. Learn how to read topographic maps, 2. Use computers and GIS to visualize topographic information, 3. Learn how to draw using a computer, 4. Learn how to measure area and distance using a computer, and 5. Learn how to interpret satellite imagery to answer basic questions about land-use.

Docs: fulltext.docx   intro.pdf   help.pdf   lecture.pdf   worksheet.docx
Keywords: area, argument, communication, data, distance, HS-ESS3.A, HS-ESS3.C, HS-ETS1.A, explanations, GIS, Google Earth, investigations, mapping, scale, systems, watershed

The California Water Puzzle

the california water puzzleFreshwater Distribution Around California

by Tim Norris and Will Federman

Students research California’s fresh water supply and demand with sets of printed maps. They then solve the “California Freshwater Puzzle” based on their new knowledge of the geographies of freshwater supply (sources) and demand (uses) in California. This module is an opportunity for students to: learn how to read different kinds of maps, combine more than one source of information to make an analysis or an argument, learn about freshwater supply and demand in California, and solve the real-world problem of freshwater supply and demand in California.

Docs: fulltext.doc   prompt.docx   worksheet.docx   maps.pdf
Keywords: argument, HS-ESS3, evidence, mapping, water

A Matter of Human Proportions

a matter of human proportionsAre You Vitruvian?

by Vikram Baliga and Sarah Baumgart

This module is an opportunity for students to learn: 1) How to use the metric system to measure linear distances; 2) Whether proportions that exist between parts of the human body are consistent across individuals; and 3) How to form a hypothesis, analyze data, and argue whether evidence supports the hypothesis.
Docs: fulltext.docx   metric.pdf   worksheet.docx   instructions.docx   handout.pdf   stats.pdf
Keywords: argument, communication, data, evidence, explanations, human anatomy, hypothesis, investigations, HS-LS1.A, HS-LS1.B, HS-LS3.B, math, models, patterns, proportions, questions, structure, systems, vitruvian man

Contour What?

contour whatby Timothy Norris and Will Federman

This modules is designed as an introduction to understanding topographic maps and GIS using Google Earth. Students perform a computer lab activity to learn how to read topographic maps, measure geographical features, and use geographic information systems (GIS).

Docs: fulltext.docx   lab.pdf   lecture.pdf
Keywords: argument, communication, contour, data, HS-ESS3.A, HS-ESS3.C, HS-ETS1.B, HS-ETS1.C, explanations, GIS, Google Earth, investigations, mapping, patterns, scale, systems

Why Do Organisms Vary?

why do organisms varyGenetic and Environmental Contributions to Trait Variation

by Beth Bastiaans and Ryan Kuntz

In this 2-month project, students design an experiment to assess phenotypic variation in one or more traits. Students use Wisconsin Fast PlantsTM (Brassica rapa). In a breeding experiment, they select a trait and analyze it during two generations of plants. Students create a pedigree by cross-pollinating the first generation with those of other students to generate a second generation of seeds with known parentage. They use linear regression to measure similarity of the selected trait in both generations. The second experiment begins with the offspring generation: students select an environmental variable, and plant enough of those offspring seeds to control that variable, again measuring the selected trait, and using linear regression to analyze effectiveness of that environmental factor.

Docs: Fulltext.pdf
Keywords: argument, data, HS-ETS2.B, explanations, genetic traits, investigations, HS-LS1.B, HS-LS3.A, HS-LS3.B, HS-LS4.B, math, organisms, phenotype, questions, variation

Roadkill Reduction with GIS

road-kill reduction with GIS

Learning to Use Layers

by Beth Bastiaans and Dan Johnston

What factors influence roadkill densities on our streets and highways? What steps can we take to protect wildlife? In this 2-hour module, students use Google Earth to learn how Geographical Information Systems (GIS) technology can help solve environmental problems. They also develop and test their own original hypotheses about roadkill, a familiar, local environmental issue. By combining multiple GIS layers in Google Earth, students develop and test hypotheses about which other landscape features may be correlated with roadkill frequency. Finally, the students discuss the difference between correlation and causation and what factors might bias their analyses.

Docs: Fulltext.pdf
Keywords: argument, causation, cause, communication, correlation, data, HS-ESS3.C, HS-ETS2.A, HS-ETS2.B, explanations, GIS, investigations, layers, math, patterns, questions, roadkill, systems