Predict This!

predict this!

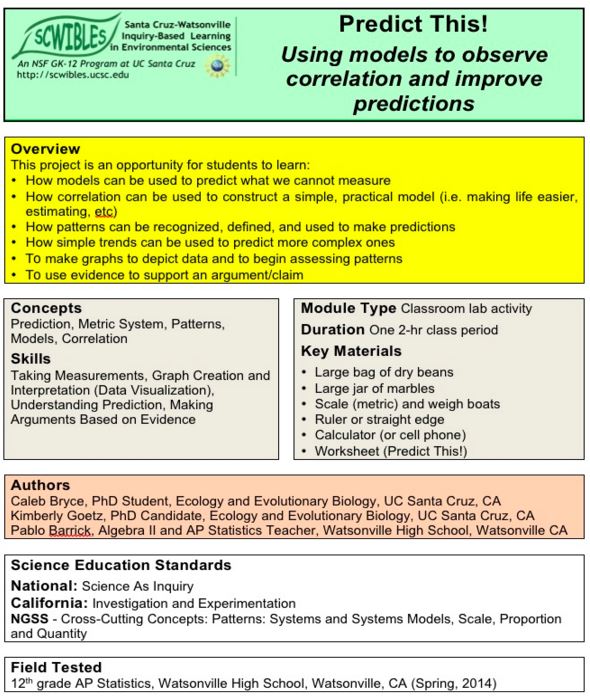
Using Models to Observe Correlation and Improve Predictions

by Caleb Bryce, Kim Goetz and Pablo Barrick

In this mini-activity, students measure the masses of specific numbers of beans and graph their data. From their graph they determine a linear model equation. Using their model, they predict the number of beans based on a given mass. The students are asked to create their own model for estimating the number of marbles in a large jar.

Students learn: 1) How to make graphs to depict data and to assess patterns; 2) How correlation can be used to construct a practical model; 3) How to use a model to predict what can not be easily measured; and 4) How to use evidence to support an argument.

Docs: fulltext.pdf
Keywords: argument, evidence, models, patterns, prediction, proportion, scale, systems

A Fact of Matter

a fact of matterExploring Trends Across the Periodic Table

by Vikram Baliga, Burnne Yew, Ruth Herradora and Bill Callahan

The periodic table is designed to reflect the key properties of all of the elements. This module gives an overview of the trends we see within each group of the periodic table. This module addresses NGSS Performance Expectation HS-PS1-1 by having students analyze trends in the periodic table in relation to atomic radius and first ionization energy.

Students learn: The relative sizes of elements in the periodic table; The definitions of atomic radius and first ionization energy; and How trends in atomic structure relate to trends in first ionization energy and atomic radius.

Docs: fulltext.pdf   lecture.pdf   handout.pdf
Keywords: atomic radius, atomic stucture, math, models, patterns, periodic table, HS-PS1.A, questions, scale, systems

Splitting Atoms

splitting atomsArguments From Evidence to Address Nuclear Energy Policy

by Duran Fiack and Chrissy MacLean

In this module students represent the views of an interest group that either supports or opposes the expansion of nuclear-generated energy in the U.S. Students learn about the source of energy within the U.S. with a focus on the potential benefits and risks associated with expansion of nuclear energy.

In this module, students learn: How to formulate arguments from evidence, how to examine different views from a range of interest groups, how to evaluate a U.S. policy statement from an interest group perspective. Students will also learn how to understand the issues surrounding public policy decisions and the potential challenges of finding a political solution in a democratic society.

Docs: fulltext.pdf   intro.pdf   reading.pdf   groupnames.pdf   worksheet.pdf
Keywords: argument, cause, communication, HS-ESS3.A, HS-ESS3.C, HS-ESS3.D, evidence, nuclear energy, policy, scale

Land to Sea

land to seaSearching for the Source of Pollutants

by Max Tarjan and Will Federman

In this module students work in small groups with map-based data to learn about watersheds and to find a likely source of pollutants. After a short introduction, students work together to intrepret ther maps provided and to support an argument, stating where the pollutant is coming from, using the map data as evidence. The module provides all the supporting materials needed to run a 90 minute activity.

In this module, students learn: 1) How substances and organisms on land can affect ocean life, 2) How human activities may disrupt ecosystem integrity, to identify the watershed that supplies a river, 3) How to interpret maps of watersheds and land use, and 4) How to combine information from different maps using map scales, and 5) How to make estimates based on map data, and engage in argument from evidence.

Docs: fulltext.pdf   introlect.pdf   summarylect.pdf   handout.pdf   watersheds.pdf   landuse.pdf   seaotters.pdf   sealions.pdf
Keywords: argument, cause, communication, data, HS-ESS2.C, evidence, explanations, HS-LS2.A, HS-LS2.C, mapping, marine mammals, models, patterns, pollution, scale, systems, watersheds

Oil Pollution Solutions

oil pollution sollution

Oil Pollution in the Marine Environment

by Kristin deNesnera and Satina Ciandro

In this “hands-on” module, students learn about: sources of oil pollution in the marine environment; the effects of oil pollution on marine life, human health, and economies; examples of major oil spills; and the challenges involved in responding to and cleaning up an oil spill.

Students learn: 1) How human activities cause oil pollution, 2) How oil pollution affects marine resources, the environment, 3) About various oil spill clean-up technologies and sorbent materials absorptivity, and 4) About the challenges related to oil spill clean-up.

A video to accompany an inquiry based educational activity (module) used in the SCWIBLES program. Created by Kristin de Nesnera.

Docs: fulltext.pdf   lecture.pdf   activity.docx   costchart.docx
Keywords: clean up, data, engineering, HS-ESS3.A, HS-ESS3.C, HS-ETS1.C, HS-ETS2.B, explanations, investigations, marine, math, models, oil pollution, HS-PS1.A, questions, scale, stability, structure, systems

Where’s My Phone

Where's my phone

Using GPS to Learn About Location on the Earth’s Surface

by Tim Norris and Will Federman

Students learn how to use latitude and longitude to describe location on the Earth’s surface. Students also learn how Global Positioning Systems (GPS) function and how we can use everyday technology (for example, smart phones) to find latitude and longitude. Two concepts are introduced: 1) Properties of electromagnetic waves (the speed of light and the relationship between distance, velocity and time), and 2) Geometric concept of triangulation. Students map the point locations of an object of interest (for example trees, benches, etc.) and then view the results of their mapping as displayed in a web page and in Google Earth®. They also learn how to place their maps into a word processing (Microsoft Word®) document.

Docs: fulltext.docx   lecture.pdf   activity.docx   notes.docx   help.docx
Keywords: communication, distance, HS-ESS2.B, GPS, investigations, latitude, longitude, mapping, math, HS-PS4.C, scale, time, velocity

My Digital Watershed

my digital watershedAnalyzing Watersheds in Google Earth

by Tim Norris and Will Federman

Students perform a computer lab activity to answer basic geographic questions about the watersheds in which they live. This module is an opportunity for students to: 1. Learn how to read topographic maps, 2. Use computers and GIS to visualize topographic information, 3. Learn how to draw using a computer, 4. Learn how to measure area and distance using a computer, and 5. Learn how to interpret satellite imagery to answer basic questions about land-use.

Docs: fulltext.docx   intro.pdf   help.pdf   lecture.pdf   worksheet.docx
Keywords: area, argument, communication, data, distance, HS-ESS3.A, HS-ESS3.C, HS-ETS1.A, explanations, GIS, Google Earth, investigations, mapping, scale, systems, watershed

Environmental Science from Space

environmental science from space

Remote Sensing and the Electromagnetic Spectrum

by Kristin McCully and Jack Horner

Students learn what remote sensing is, how it works, and how scientists use it, with a focus on Landsat satellite and imagery. They create, and then interpret, a remote sensing image of a planet and remote sensing imagery available on the Internet. Students review the structure of a wave; solve problems using speed, wavelength, and frequency; and discuss the uses of each type of radiation in the electromagnetic spectrum. Finally, students examine and analyze a remote sensing image of a rain forest.

Docs: fulltext.pdf   presentation.pdf   handout.doc   handoutkey.doc
Keywords: data, electromagnetic spectrum, HS-ESS2.D, HS-ETS1.A, explanations, iimagery, models, HS-PS4.A, HS-PS4.B, HS-PS4.C, rain forest, remote sensing, scale, systems

Contour What?

contour whatby Timothy Norris and Will Federman

This modules is designed as an introduction to understanding topographic maps and GIS using Google Earth. Students perform a computer lab activity to learn how to read topographic maps, measure geographical features, and use geographic information systems (GIS).

Docs: fulltext.docx   lab.pdf   lecture.pdf
Keywords: argument, communication, contour, data, HS-ESS3.A, HS-ESS3.C, HS-ETS1.B, HS-ETS1.C, explanations, GIS, Google Earth, investigations, mapping, patterns, scale, systems

Otters and Urchins

otters and urchinsEcology of The Kelp Forest

by Kristin McCully and Jack Horner

This multi-week modules is designed as a general introduction to ecology as a science, while exploring the excitement of the charismatic kelp forest ecosystem. It introduces the fields of population, community, ecosystem, and conservation ecology, and helps build skills in using equations, creating graphs, interpreting maps, and modeling ecological systems.

Docs: poplecture.pdf   ecolecture.pdf   commlecture.pdf   introlecture.pdf   conslecture.pdf   worksheets.doc   worksheetskey.pdf   studyguide.pdf   studyguidekey.pdf
Keywords: communication, data, ecosystem, explanations, graphs, kelp forest, HS-LS1.C, HS-LS2.A, HS-LS2.B, HS-LS2.C, marine food web, marine science, math, otters, patterns, scale, stability, systems, urchins

Observing, Recording, and Inquiring

observing recording and inquiryingScientific Drawing

by Jennie Liss Ohayon and Satina Ciandro

Students learn about the importance of recording scientific information through detailed, realistic illustrations. This 75-minute module offers students experience with several approaches to scientific illustration, including detailed drawings of preserved specimens and quick sketches of moving animals. They also learn about trait variation through drawings that compare different individuals of the same species. The module aims to teach the principles of recording scientific information and to make the practice of creating scientific artwork accessible to everyone, including those without an extensive background in either science or art.

Docs: Fulltext.pdf
Keywords: inquirying, HS-LS3.B, models, observing, recording, scale, scientific illustration