Toxic Avengers

Featured

toxic avengersTools for Uncovering the Human Geography of Pollution

by Jenny Lovell and Dawn Krenz

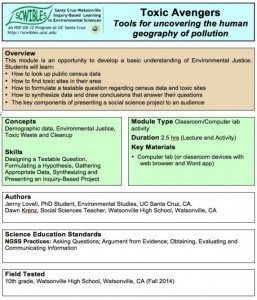
Environmental Justice (EJ) describes the trend of environmental impacts disproportionately affecting minority communities. It is a great subject to get students engaged about their neighborhoods and health. The Toxics Movement is closely related to EJ and shares the common interest of all people having the right to a clean and healthy environment.

Students learn: 1) How to look up public census data, 2) How to find toxic sites in their neighborhood, 3) How to formulate a testable question regarding census data and toxic sites, 4) How to synthesize data and draw conclusions that answer their questions, and 5) The key components of presenting a social science project to an audience.

Docs: fulltext.docx   presentation.pptx   activity.docx   checklist.docx
K
eywords: argument, cause, communication, data, environmental justice, mapping, questions, toxic sites


Land to Sea

land to seaSearching for the Source of Pollutants

by Max Tarjan and Will Federman

In this module students work in small groups with map-based data to learn about watersheds and to find a likely source of pollutants. After a short introduction, students work together to intrepret ther maps provided and to support an argument, stating where the pollutant is coming from, using the map data as evidence. The module provides all the supporting materials needed to run a 90 minute activity.

In this module, students learn: 1) How substances and organisms on land can affect ocean life, 2) How human activities may disrupt ecosystem integrity, to identify the watershed that supplies a river, 3) How to interpret maps of watersheds and land use, and 4) How to combine information from different maps using map scales, and 5) How to make estimates based on map data, and engage in argument from evidence.

Docs: fulltext.pdf   introlect.pdf   summarylect.pdf   handout.pdf   watersheds.pdf   landuse.pdf   seaotters.pdf   sealions.pdf
Keywords: argument, cause, communication, data, HS-ESS2.C, evidence, explanations, HS-LS2.A, HS-LS2.C, mapping, marine mammals, models, patterns, pollution, scale, systems, watersheds

Where’s My Phone

Where's my phone

Using GPS to Learn About Location on the Earth’s Surface

by Tim Norris and Will Federman

Students learn how to use latitude and longitude to describe location on the Earth’s surface. Students also learn how Global Positioning Systems (GPS) function and how we can use everyday technology (for example, smart phones) to find latitude and longitude. Two concepts are introduced: 1) Properties of electromagnetic waves (the speed of light and the relationship between distance, velocity and time), and 2) Geometric concept of triangulation. Students map the point locations of an object of interest (for example trees, benches, etc.) and then view the results of their mapping as displayed in a web page and in Google Earth®. They also learn how to place their maps into a word processing (Microsoft Word®) document.

Docs: fulltext.docx   lecture.pdf   activity.docx   notes.docx   help.docx
Keywords: communication, distance, HS-ESS2.B, GPS, investigations, latitude, longitude, mapping, math, HS-PS4.C, scale, time, velocity

My Digital Watershed

my digital watershedAnalyzing Watersheds in Google Earth

by Tim Norris and Will Federman

Students perform a computer lab activity to answer basic geographic questions about the watersheds in which they live. This module is an opportunity for students to: 1. Learn how to read topographic maps, 2. Use computers and GIS to visualize topographic information, 3. Learn how to draw using a computer, 4. Learn how to measure area and distance using a computer, and 5. Learn how to interpret satellite imagery to answer basic questions about land-use.

Docs: fulltext.docx   intro.pdf   help.pdf   lecture.pdf   worksheet.docx
Keywords: area, argument, communication, data, distance, HS-ESS3.A, HS-ESS3.C, HS-ETS1.A, explanations, GIS, Google Earth, investigations, mapping, scale, systems, watershed

The California Water Puzzle

the california water puzzle
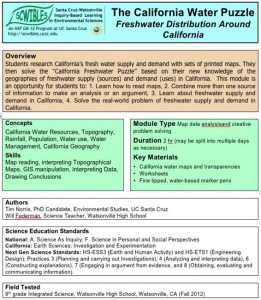
Freshwater Distribution Around California

by Tim Norris and Will Federman

Students research California’s fresh water supply and demand with sets of printed maps. They then solve the “California Freshwater Puzzle” based on their new knowledge of the geographies of freshwater supply (sources) and demand (uses) in California. This module is an opportunity for students to: learn how to read different kinds of maps, combine more than one source of information to make an analysis or an argument, learn about freshwater supply and demand in California, and solve the real-world problem of freshwater supply and demand in California.

Docs: fulltext.doc   prompt.docx   worksheet.docx   maps.pdf
Keywords: argument, HS-ESS3, evidence, mapping, water

Contour What?

contour whatby Timothy Norris and Will Federman

This modules is designed as an introduction to understanding topographic maps and GIS using Google Earth. Students perform a computer lab activity to learn how to read topographic maps, measure geographical features, and use geographic information systems (GIS).

Docs: fulltext.docx   lab.pdf   lecture.pdf
Keywords: argument, communication, contour, data, HS-ESS3.A, HS-ESS3.C, HS-ETS1.B, HS-ETS1.C, explanations, GIS, Google Earth, investigations, mapping, patterns, scale, systems