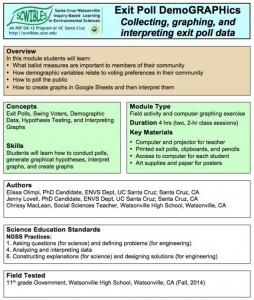
Exit Poll DemoGRAPHics

Exit_poll_demoGRAPHicsCollecting, Graphing, and Interpreting Exit Poll Data

by Elissa Olimpi, Jenny Lovell and Chrissy MacLean

Exit polls are used to determine or predict what people believe, how they feel about something, or in what way they will act. This module is designed to lead students through the process of designing an exit poll to answer a hypothesis about a local, state, or national election. The data they collect can be compiled and analyzed as if the poll were being presented on the news. In this way, students can gain a deeper understanding of one part of the legislative process.

Students learn: 1) What ballot measures are important to members of their community 2) How to poll the public, 3) How to generate graphical hypotheses and 4) How to create graphs in Google Sheets and interpret them.

Docs: fulltext.docx   form.docx   organizer.docx
Keywords: community, data, explanations, graphs, hypothesis, polling, questions

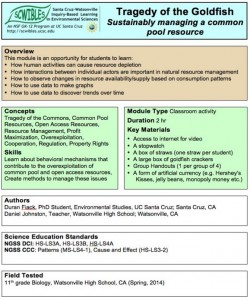
Tragedy of the Goldfish

tragedy of the goldfishSustainably Managing a Common Pool Resource
by Duran Fiack and Dan Johnston

The tragedy of the commons is a dilemma when multiple individuals, acting independently, deplete a shared, limited resource. Articulating solutions to the tragedy of the commons is one of the main problems of environmental policy and natural resource managers. In the absence of enlightened self-interest, altruistic or cooperative behavior, some form of authority is needed to solve the collective action problem.

In this module, students represent independent actors seeking to catch fish to support their livelihood. Students learn: 1) How human activities can cause resource depletion, 2) How interactions between individual actors are important in natural resource management, and 3) How to use data to make graphs and to discover trends over time.

Docs: fullltext.docx   lecture.pptx   info.docx   handout1.docx
Keywords: cause, common pool resource, environmental policy, graphs, HS-LS3.A, HS-LS3.B, HS-LS4.A, natural resource, patterns

Go With the Flow

go with the flowThe Impact of Slope and Substrate on Water Flow Speed
by Catherine Wade and Will Federman

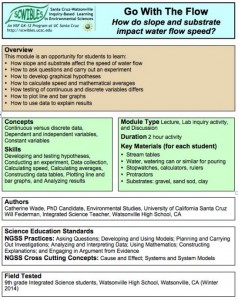
Water constantly cycles through the earth and the atmosphere. The study of water flow in streams and rivers and on impervious surfaces involves many variables. These include the slope or gradient of a stream, surface, or pipe and the type of substrate that water is flowing through. In this lab activity, students investigate how the speed of water flow changes with different slopes and different substrates.

Students learn: 1) How slope and substrate affect the speed of water flow, 2) How to ask questions, carry out an experiment and develop graphical hypotheses and 3) How to calculate speed and mathematical averages, and 4) How to plot line and bar graphs, and use data to explain results.

Docs: fulltext.docx   presentation.ppt   worksheet.docx
Keywords: argument, cause, data, erosion, HS-ESS2.C, explanations, graphs, hypothesis, investigations, math, models, questions, systems, water

Top Carnivore

top carnivoreTrophic Cascades and Predator-Prey Dynamics

by Veronica Yovovich and Dan Johnston

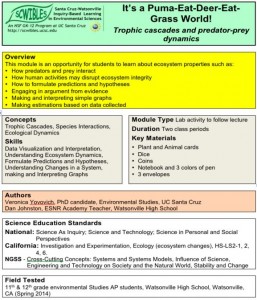
This module presents a “game” activity in which students learn about trophic cascades and how the different elements of a food chain interact. The module explores the importance of top-down regulation and how predators may regulate the habitats in which they live.

In this module, students learn: 1) How predators and prey interact, 2) How human activities may disrupt ecosystem integrity, 3) How to formulate predictions and hypotheses, 4) How to engage in argument from evidence, make and interpret simple graphs, and make estimates based on data they collect.

Docs: fulltext.pdf   handout.pdf   homework.pdf   cards.pdf
Keywords: argument, cause, data, evidence, food web, graphs, HS-LS2.A, HS-LS2.C, math, models, predators, prey, stability, systems, trophic cascades

Otters and Urchins

otters and urchinsEcology of The Kelp Forest

by Kristin McCully and Jack Horner

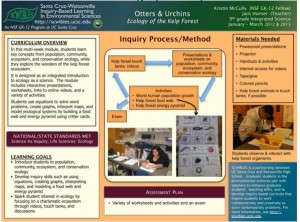
This multi-week modules is designed as a general introduction to ecology as a science, while exploring the excitement of the charismatic kelp forest ecosystem. It introduces the fields of population, community, ecosystem, and conservation ecology, and helps build skills in using equations, creating graphs, interpreting maps, and modeling ecological systems.

Docs: poplecture.pdf   ecolecture.pdf   commlecture.pdf   introlecture.pdf   conslecture.pdf   worksheets.doc   worksheetskey.pdf   studyguide.pdf   studyguidekey.pdf
Keywords: communication, data, ecosystem, explanations, graphs, kelp forest, HS-LS1.C, HS-LS2.A, HS-LS2.B, HS-LS2.C, marine food web, marine science, math, otters, patterns, scale, stability, systems, urchins

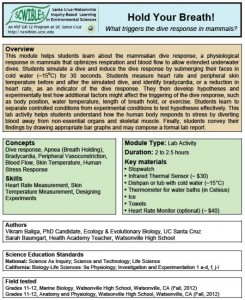
Hold Your Breath!

hold your breathby Vikram Baliga and Sarah Baumgart

This module helps students learn about the mammalian dive response. Students simulate a dive by submerging their faces in cold water for 30 seconds. They measure heart rate and body temperature before and after the “dive”. Students learn how the human body responds to stress (cold water) and they convey their findings using bar graphs and a final lab report.


Fellow Vikram Baliga produced this video to accompany his Dive Response module for inquiry-based education in high school science lab.

Docs: fulltext.docx   worksheet.docx
Keywords: body temperature, cause, data, dive response, graphs, heart rate, investigations, HS-LS1.A, math, questions, stability, systems