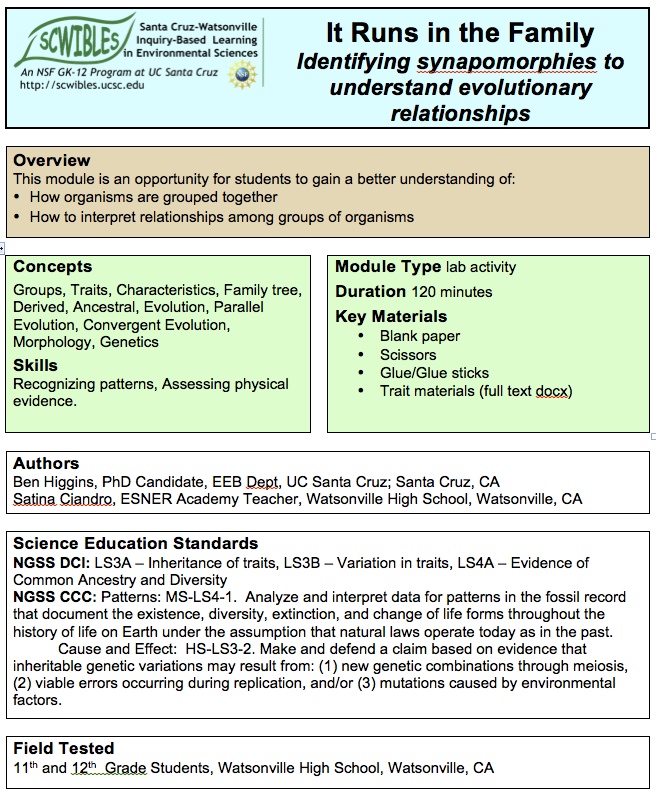
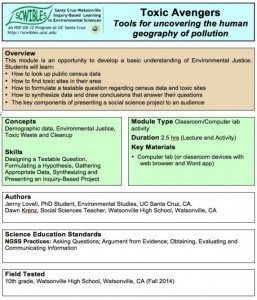
 Tools for Uncovering the Human Geography of Pollution
by Jenny Lovell and Dawn Krenz
Environmental Justice (EJ) describes the trend of environmental impacts disproportionately affecting minority communities. It is a great subject to get students engaged about their neighborhoods and health. The Toxics Movement is closely related to EJ and shares the common interest of all people having the right to a clean and healthy environment.
Students learn: 1) How to look up public census data, 2) How to find toxic sites in their neighborhood, 3) How to formulate a testable question regarding census data and toxic sites, 4) How to synthesize data and draw conclusions that answer their questions, and 5) The key components of presenting a social science project to an audience.
Docs: fulltext.docx presentation.pptx activity.docx checklist.docx
Keywords: argument, cause, communication, data, environmental justice, mapping, questions, toxic sites
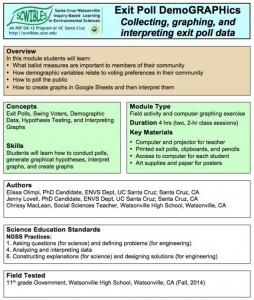 Collecting, Graphing, and Interpreting Exit Poll Data
 Measuring Your Response to Exercise
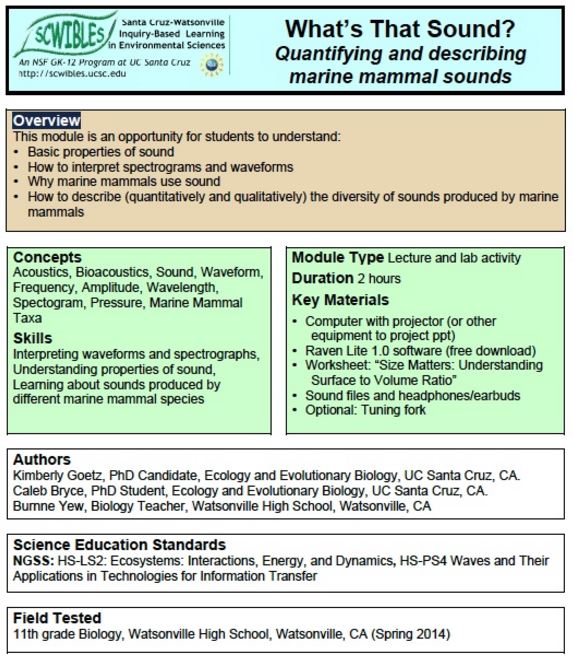
  Understanding the Surface Area-to-Volume Ratio
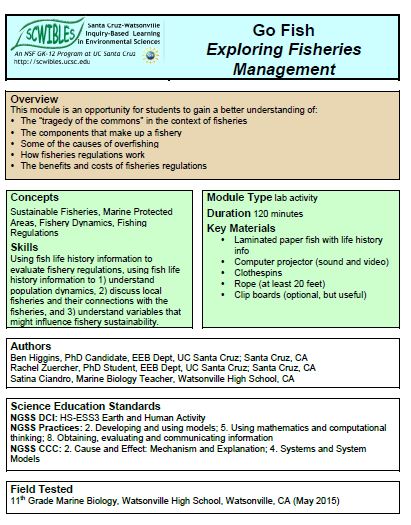
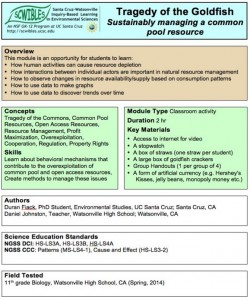 Sustainably Managing a Common Pool Resource
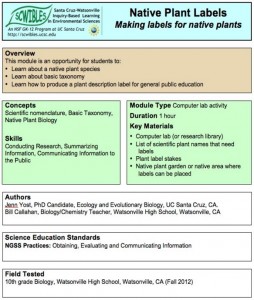 Making Labels for Native Plants
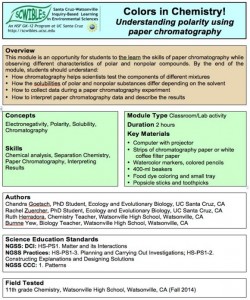 Using Paper Chromatography to Understand Polarity
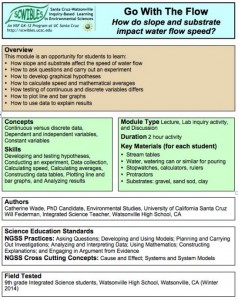 The Impact of Slope and Substrate on Water Flow Speed
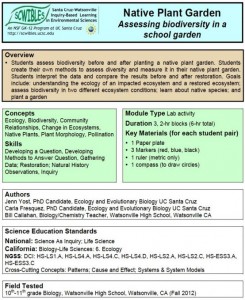 Assessing Biodiversity Using a School Garden
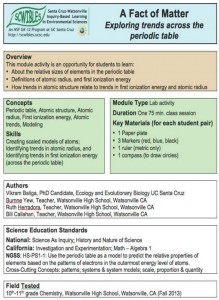 Exploring Trends Across the Periodic Table
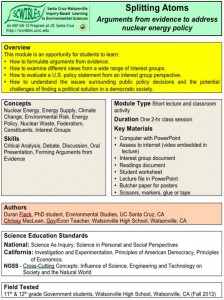 Arguments From Evidence to Address Nuclear Energy Policy
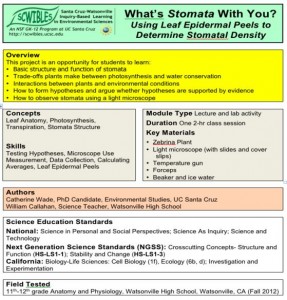 Using Leaf Epidermal Peels to Determine Stomatal Density
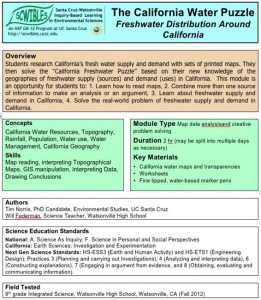 Freshwater Distribution Around California
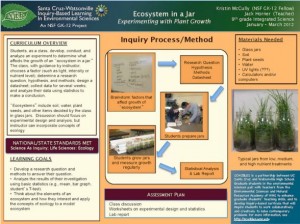 Experimenting With Plant Growth
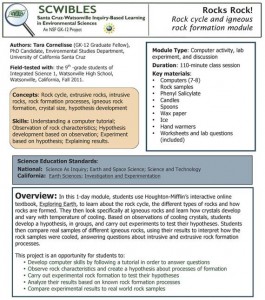 Rock cycle and igneous rock formation
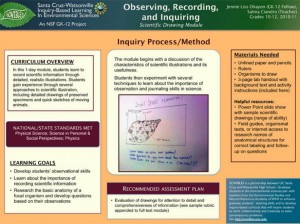 Scientific Drawing
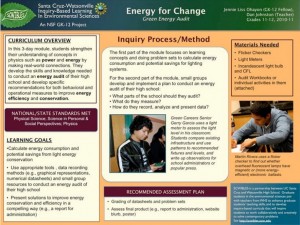 Green Energy Audit
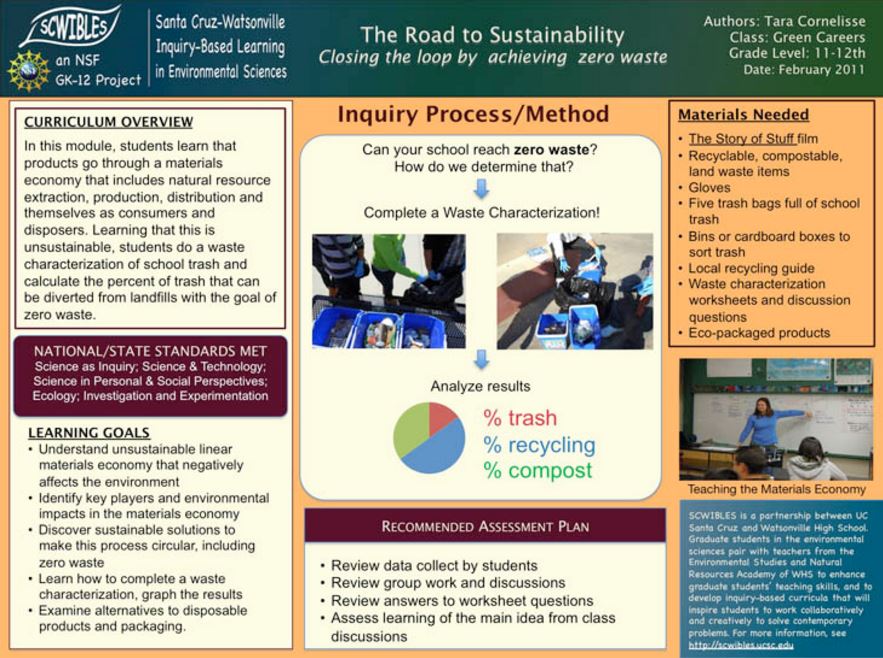
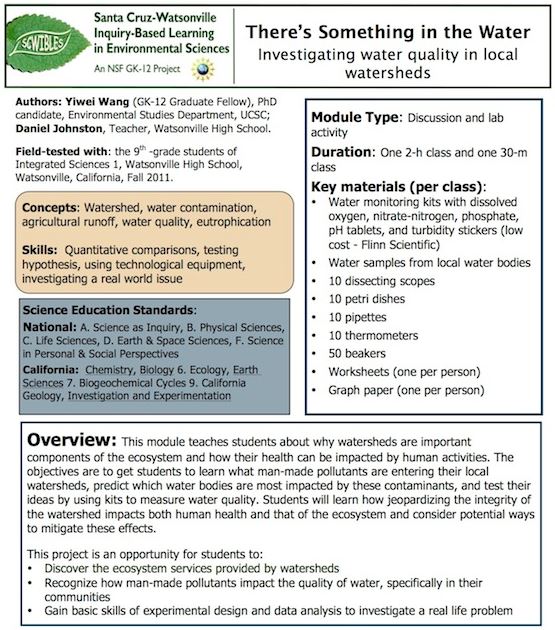
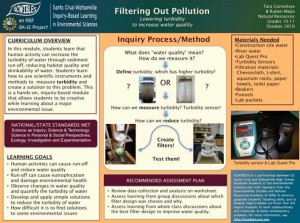 Lowering Turbidity to Increase Water Quality